Belizean vs Colombian Family Households
COMPARE
Belizean
Colombian
Family Households
Family Households Comparison
Belizeans
Colombians
64.8%
FAMILY HOUSEHOLDS
89.3/ 100
METRIC RATING
133rd/ 347
METRIC RANK
66.3%
FAMILY HOUSEHOLDS
100.0/ 100
METRIC RATING
52nd/ 347
METRIC RANK
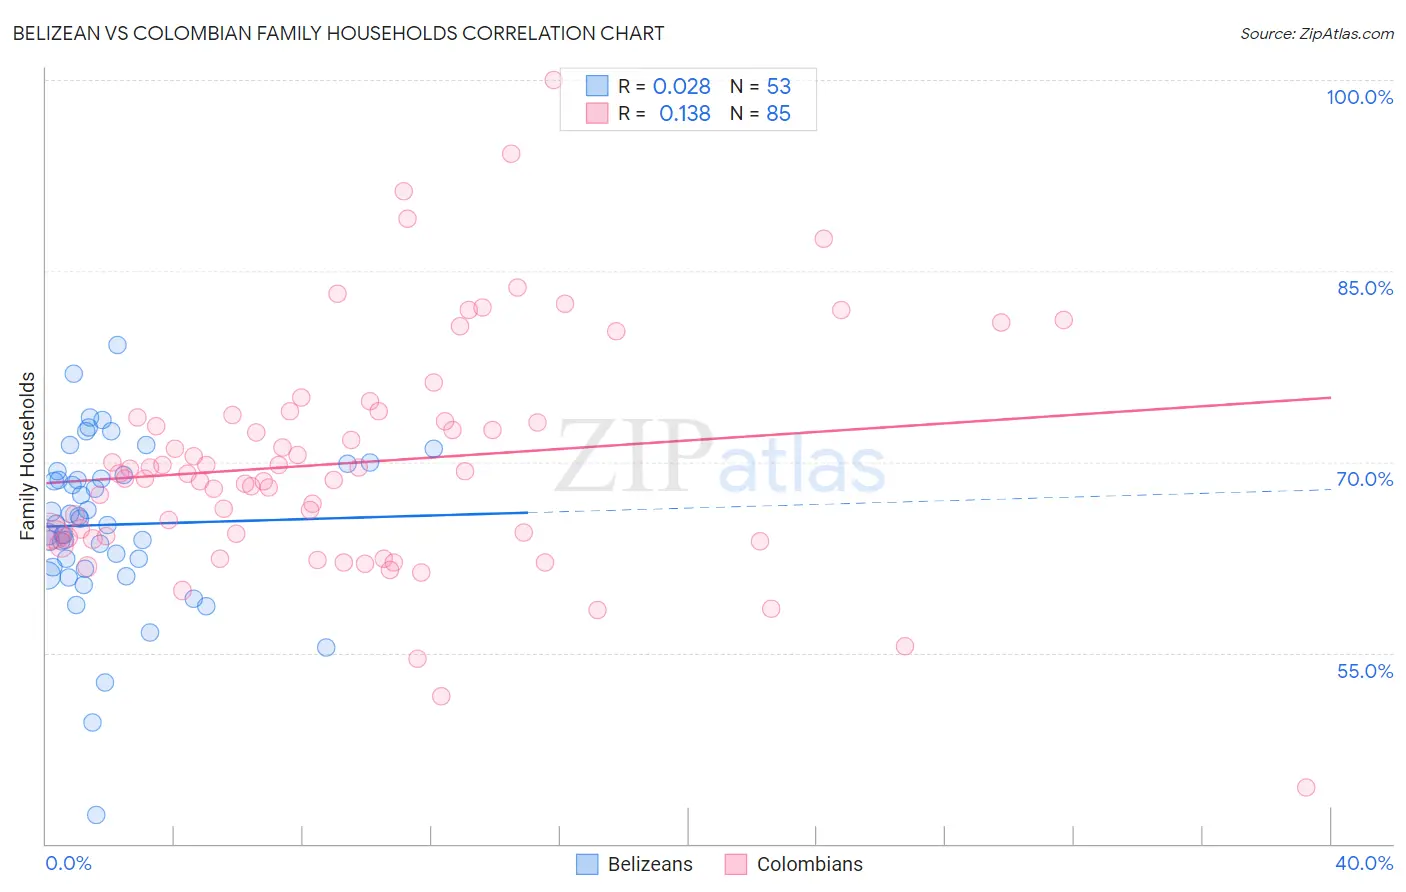
Belizean vs Colombian Family Households Correlation Chart
The statistical analysis conducted on geographies consisting of 144,151,479 people shows no correlation between the proportion of Belizeans and percentage of family households in the United States with a correlation coefficient (R) of 0.028 and weighted average of 64.8%. Similarly, the statistical analysis conducted on geographies consisting of 419,324,434 people shows a poor positive correlation between the proportion of Colombians and percentage of family households in the United States with a correlation coefficient (R) of 0.138 and weighted average of 66.3%, a difference of 2.3%.
Family Households Correlation Summary
| Measurement | Belizean | Colombian |
| Minimum | 42.3% | 44.4% |
| Maximum | 79.2% | 100.0% |
| Range | 36.9% | 55.6% |
| Mean | 65.1% | 70.0% |
| Median | 65.1% | 69.1% |
| Interquartile 25% (IQ1) | 61.6% | 64.1% |
| Interquartile 75% (IQ3) | 69.1% | 73.6% |
| Interquartile Range (IQR) | 7.5% | 9.5% |
| Standard Deviation (Sample) | 6.6% | 9.2% |
| Standard Deviation (Population) | 6.5% | 9.2% |
Similar Demographics by Family Households
Demographics Similar to Belizeans by Family Households
In terms of family households, the demographic groups most similar to Belizeans are Cajun (64.8%, a difference of 0.0%), Nonimmigrants (64.8%, a difference of 0.030%), Immigrants from Italy (64.8%, a difference of 0.040%), Greek (64.7%, a difference of 0.040%), and Maltese (64.7%, a difference of 0.060%).
| Demographics | Rating | Rank | Family Households |
| Panamanians | 92.4 /100 | #126 | Exceptional 64.8% |
| Immigrants | Panama | 92.0 /100 | #127 | Exceptional 64.8% |
| Italians | 91.9 /100 | #128 | Exceptional 64.8% |
| Immigrants | Ecuador | 91.4 /100 | #129 | Exceptional 64.8% |
| Immigrants | Italy | 90.2 /100 | #130 | Exceptional 64.8% |
| Immigrants | Nonimmigrants | 90.1 /100 | #131 | Exceptional 64.8% |
| Cajuns | 89.4 /100 | #132 | Excellent 64.8% |
| Belizeans | 89.3 /100 | #133 | Excellent 64.8% |
| Greeks | 88.1 /100 | #134 | Excellent 64.7% |
| Maltese | 87.4 /100 | #135 | Excellent 64.7% |
| Immigrants | China | 86.6 /100 | #136 | Excellent 64.7% |
| Immigrants | Scotland | 86.4 /100 | #137 | Excellent 64.7% |
| Basques | 85.5 /100 | #138 | Excellent 64.7% |
| Immigrants | Jamaica | 85.3 /100 | #139 | Excellent 64.7% |
| Immigrants | North Macedonia | 84.9 /100 | #140 | Excellent 64.7% |
Demographics Similar to Colombians by Family Households
In terms of family households, the demographic groups most similar to Colombians are Afghan (66.3%, a difference of 0.010%), Immigrants from Colombia (66.3%, a difference of 0.010%), Native/Alaskan (66.4%, a difference of 0.14%), Navajo (66.4%, a difference of 0.16%), and Immigrants (66.1%, a difference of 0.17%).
| Demographics | Rating | Rank | Family Households |
| Venezuelans | 100.0 /100 | #45 | Exceptional 66.5% |
| Arapaho | 100.0 /100 | #46 | Exceptional 66.5% |
| Bolivians | 100.0 /100 | #47 | Exceptional 66.5% |
| Immigrants | Venezuela | 100.0 /100 | #48 | Exceptional 66.4% |
| Immigrants | South Central Asia | 100.0 /100 | #49 | Exceptional 66.4% |
| Navajo | 100.0 /100 | #50 | Exceptional 66.4% |
| Natives/Alaskans | 100.0 /100 | #51 | Exceptional 66.4% |
| Colombians | 100.0 /100 | #52 | Exceptional 66.3% |
| Afghans | 100.0 /100 | #53 | Exceptional 66.3% |
| Immigrants | Colombia | 100.0 /100 | #54 | Exceptional 66.3% |
| Immigrants | Immigrants | 100.0 /100 | #55 | Exceptional 66.1% |
| Immigrants | Hong Kong | 100.0 /100 | #56 | Exceptional 66.1% |
| Pennsylvania Germans | 100.0 /100 | #57 | Exceptional 66.1% |
| Immigrants | Asia | 100.0 /100 | #58 | Exceptional 66.1% |
| Immigrants | Korea | 100.0 /100 | #59 | Exceptional 66.0% |