Immigrants from Dominican Republic vs Colombian Family Households
COMPARE
Immigrants from Dominican Republic
Colombian
Family Households
Family Households Comparison
Immigrants from Dominican Republic
Colombians
63.3%
FAMILY HOUSEHOLDS
1.0/ 100
METRIC RATING
253rd/ 347
METRIC RANK
66.3%
FAMILY HOUSEHOLDS
100.0/ 100
METRIC RATING
52nd/ 347
METRIC RANK
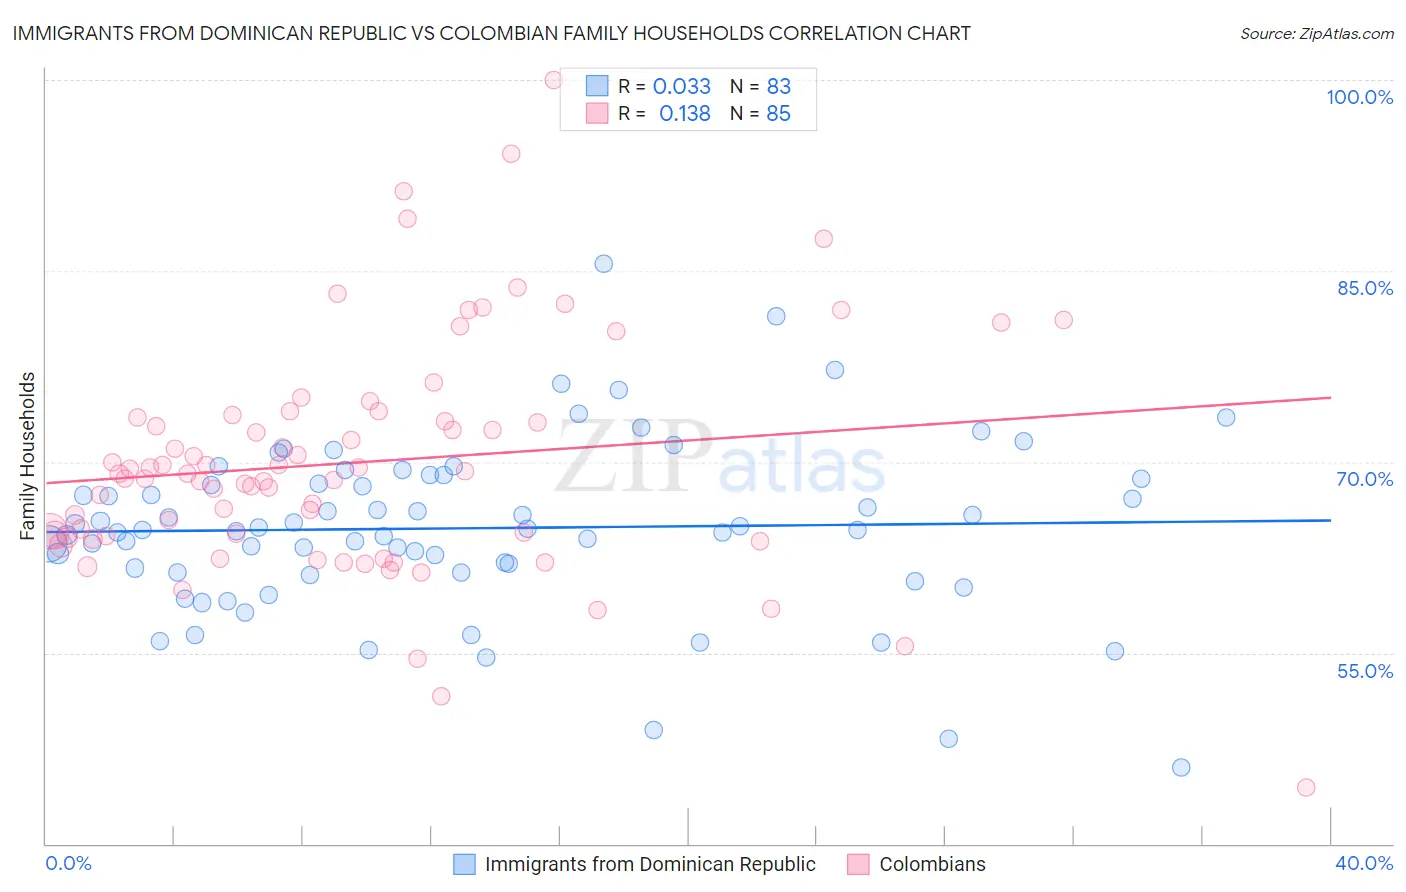
Immigrants from Dominican Republic vs Colombian Family Households Correlation Chart
The statistical analysis conducted on geographies consisting of 274,978,425 people shows no correlation between the proportion of Immigrants from Dominican Republic and percentage of family households in the United States with a correlation coefficient (R) of 0.033 and weighted average of 63.3%. Similarly, the statistical analysis conducted on geographies consisting of 419,324,434 people shows a poor positive correlation between the proportion of Colombians and percentage of family households in the United States with a correlation coefficient (R) of 0.138 and weighted average of 66.3%, a difference of 4.6%.
Family Households Correlation Summary
| Measurement | Immigrants from Dominican Republic | Colombian |
| Minimum | 46.0% | 44.4% |
| Maximum | 85.5% | 100.0% |
| Range | 39.6% | 55.6% |
| Mean | 64.8% | 70.0% |
| Median | 64.7% | 69.1% |
| Interquartile 25% (IQ1) | 61.3% | 64.1% |
| Interquartile 75% (IQ3) | 68.7% | 73.6% |
| Interquartile Range (IQR) | 7.4% | 9.5% |
| Standard Deviation (Sample) | 6.7% | 9.2% |
| Standard Deviation (Population) | 6.6% | 9.2% |
Similar Demographics by Family Households
Demographics Similar to Immigrants from Dominican Republic by Family Households
In terms of family households, the demographic groups most similar to Immigrants from Dominican Republic are Slovak (63.3%, a difference of 0.010%), Bahamian (63.3%, a difference of 0.020%), Potawatomi (63.3%, a difference of 0.030%), Taiwanese (63.3%, a difference of 0.040%), and Luxembourger (63.3%, a difference of 0.050%).
| Demographics | Rating | Rank | Family Households |
| Immigrants | Ghana | 1.6 /100 | #246 | Tragic 63.4% |
| Immigrants | Uzbekistan | 1.5 /100 | #247 | Tragic 63.4% |
| Dominicans | 1.5 /100 | #248 | Tragic 63.4% |
| Russians | 1.4 /100 | #249 | Tragic 63.4% |
| Immigrants | Japan | 1.4 /100 | #250 | Tragic 63.4% |
| Taiwanese | 1.2 /100 | #251 | Tragic 63.3% |
| Bahamians | 1.1 /100 | #252 | Tragic 63.3% |
| Immigrants | Dominican Republic | 1.0 /100 | #253 | Tragic 63.3% |
| Slovaks | 1.0 /100 | #254 | Tragic 63.3% |
| Potawatomi | 1.0 /100 | #255 | Tragic 63.3% |
| Luxembourgers | 0.9 /100 | #256 | Tragic 63.3% |
| Icelanders | 0.8 /100 | #257 | Tragic 63.3% |
| Immigrants | Barbados | 0.7 /100 | #258 | Tragic 63.2% |
| Immigrants | Western Europe | 0.6 /100 | #259 | Tragic 63.2% |
| Cypriots | 0.6 /100 | #260 | Tragic 63.2% |
Demographics Similar to Colombians by Family Households
In terms of family households, the demographic groups most similar to Colombians are Afghan (66.3%, a difference of 0.010%), Immigrants from Colombia (66.3%, a difference of 0.010%), Native/Alaskan (66.4%, a difference of 0.14%), Navajo (66.4%, a difference of 0.16%), and Immigrants (66.1%, a difference of 0.17%).
| Demographics | Rating | Rank | Family Households |
| Venezuelans | 100.0 /100 | #45 | Exceptional 66.5% |
| Arapaho | 100.0 /100 | #46 | Exceptional 66.5% |
| Bolivians | 100.0 /100 | #47 | Exceptional 66.5% |
| Immigrants | Venezuela | 100.0 /100 | #48 | Exceptional 66.4% |
| Immigrants | South Central Asia | 100.0 /100 | #49 | Exceptional 66.4% |
| Navajo | 100.0 /100 | #50 | Exceptional 66.4% |
| Natives/Alaskans | 100.0 /100 | #51 | Exceptional 66.4% |
| Colombians | 100.0 /100 | #52 | Exceptional 66.3% |
| Afghans | 100.0 /100 | #53 | Exceptional 66.3% |
| Immigrants | Colombia | 100.0 /100 | #54 | Exceptional 66.3% |
| Immigrants | Immigrants | 100.0 /100 | #55 | Exceptional 66.1% |
| Immigrants | Hong Kong | 100.0 /100 | #56 | Exceptional 66.1% |
| Pennsylvania Germans | 100.0 /100 | #57 | Exceptional 66.1% |
| Immigrants | Asia | 100.0 /100 | #58 | Exceptional 66.1% |
| Immigrants | Korea | 100.0 /100 | #59 | Exceptional 66.0% |