Immigrants from Europe vs Immigrants Divorced or Separated
COMPARE
Immigrants from Europe
Immigrants
Divorced or Separated
Divorced or Separated Comparison
Immigrants from Europe
Immigrants
11.6%
DIVORCED OR SEPARATED
99.2/ 100
METRIC RATING
88th/ 347
METRIC RANK
11.8%
DIVORCED OR SEPARATED
93.7/ 100
METRIC RATING
123rd/ 347
METRIC RANK
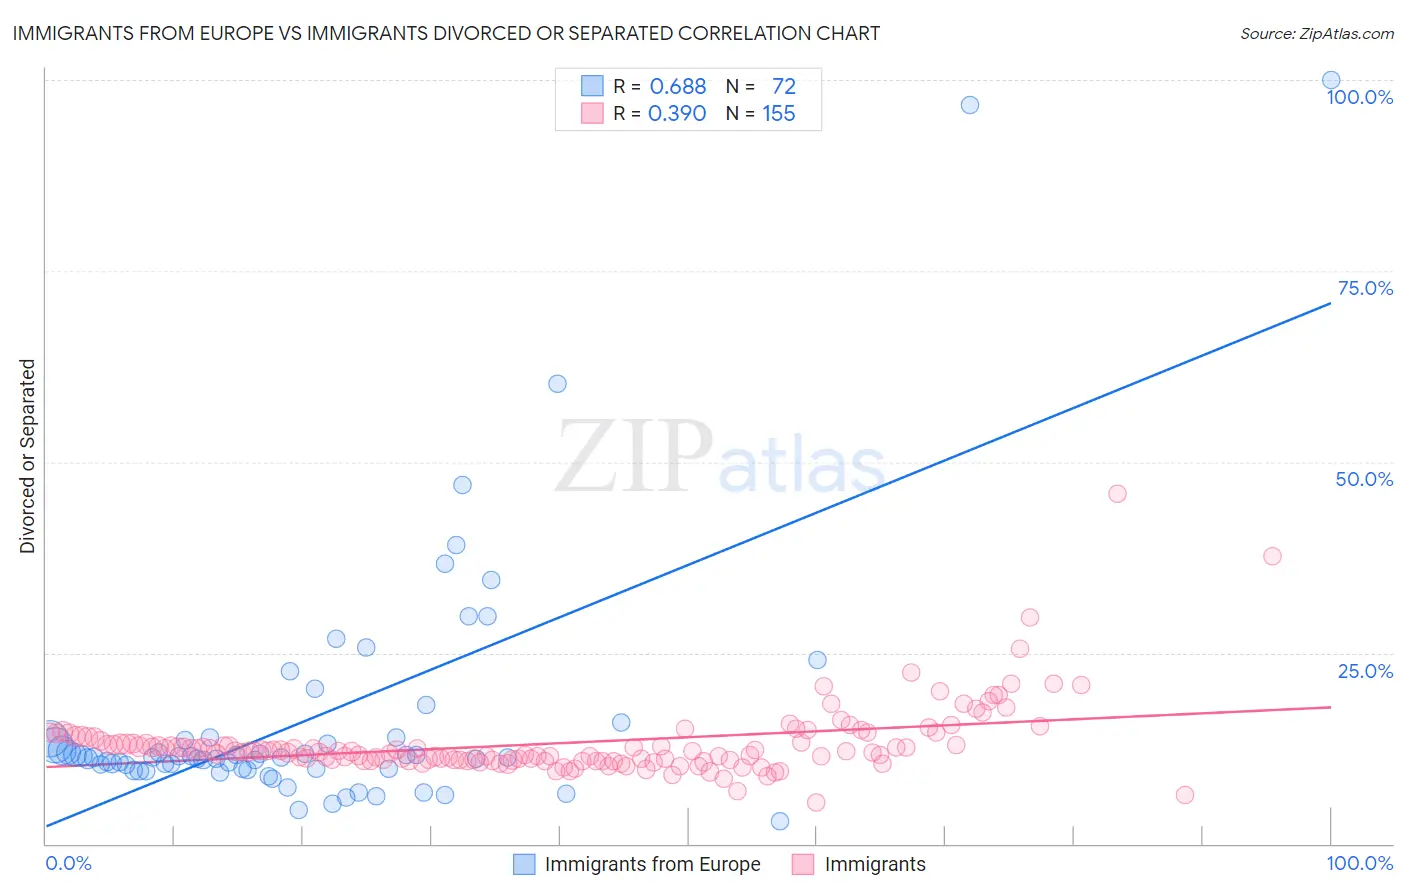
Immigrants from Europe vs Immigrants Divorced or Separated Correlation Chart
The statistical analysis conducted on geographies consisting of 547,048,453 people shows a significant positive correlation between the proportion of Immigrants from Europe and percentage of population currently divorced or separated in the United States with a correlation coefficient (R) of 0.688 and weighted average of 11.6%. Similarly, the statistical analysis conducted on geographies consisting of 577,228,923 people shows a mild positive correlation between the proportion of Immigrants and percentage of population currently divorced or separated in the United States with a correlation coefficient (R) of 0.390 and weighted average of 11.8%, a difference of 1.9%.
Divorced or Separated Correlation Summary
| Measurement | Immigrants from Europe | Immigrants |
| Minimum | 3.0% | 5.4% |
| Maximum | 100.0% | 45.8% |
| Range | 97.0% | 40.4% |
| Mean | 16.6% | 13.1% |
| Median | 11.3% | 12.1% |
| Interquartile 25% (IQ1) | 9.8% | 10.9% |
| Interquartile 75% (IQ3) | 13.8% | 13.5% |
| Interquartile Range (IQR) | 4.0% | 2.6% |
| Standard Deviation (Sample) | 17.1% | 4.7% |
| Standard Deviation (Population) | 17.0% | 4.7% |
Similar Demographics by Divorced or Separated
Demographics Similar to Immigrants from Europe by Divorced or Separated
In terms of divorced or separated, the demographic groups most similar to Immigrants from Europe are Immigrants from Nepal (11.6%, a difference of 0.030%), Immigrants from Southern Europe (11.6%, a difference of 0.040%), Immigrants from Latvia (11.6%, a difference of 0.050%), Immigrants from Albania (11.5%, a difference of 0.12%), and Zimbabwean (11.6%, a difference of 0.14%).
| Demographics | Rating | Rank | Divorced or Separated |
| Russians | 99.4 /100 | #81 | Exceptional 11.5% |
| Immigrants | Romania | 99.3 /100 | #82 | Exceptional 11.5% |
| Immigrants | Bulgaria | 99.3 /100 | #83 | Exceptional 11.5% |
| Bulgarians | 99.3 /100 | #84 | Exceptional 11.5% |
| Immigrants | Albania | 99.3 /100 | #85 | Exceptional 11.5% |
| Immigrants | Latvia | 99.2 /100 | #86 | Exceptional 11.6% |
| Immigrants | Nepal | 99.2 /100 | #87 | Exceptional 11.6% |
| Immigrants | Europe | 99.2 /100 | #88 | Exceptional 11.6% |
| Immigrants | Southern Europe | 99.1 /100 | #89 | Exceptional 11.6% |
| Zimbabweans | 99.0 /100 | #90 | Exceptional 11.6% |
| Spanish American Indians | 99.0 /100 | #91 | Exceptional 11.6% |
| Immigrants | Denmark | 98.9 /100 | #92 | Exceptional 11.6% |
| Arabs | 98.9 /100 | #93 | Exceptional 11.6% |
| Immigrants | Fiji | 98.9 /100 | #94 | Exceptional 11.6% |
| Immigrants | Serbia | 98.8 /100 | #95 | Exceptional 11.6% |
Demographics Similar to Immigrants by Divorced or Separated
In terms of divorced or separated, the demographic groups most similar to Immigrants are Menominee (11.8%, a difference of 0.020%), Ugandan (11.8%, a difference of 0.080%), Romanian (11.8%, a difference of 0.13%), Iraqi (11.8%, a difference of 0.15%), and Ukrainian (11.8%, a difference of 0.19%).
| Demographics | Rating | Rank | Divorced or Separated |
| Immigrants | Iraq | 95.4 /100 | #116 | Exceptional 11.7% |
| Immigrants | Uganda | 95.3 /100 | #117 | Exceptional 11.7% |
| Ecuadorians | 95.3 /100 | #118 | Exceptional 11.7% |
| Syrians | 95.1 /100 | #119 | Exceptional 11.7% |
| Iraqis | 94.6 /100 | #120 | Exceptional 11.8% |
| Romanians | 94.5 /100 | #121 | Exceptional 11.8% |
| Menominee | 93.8 /100 | #122 | Exceptional 11.8% |
| Immigrants | Immigrants | 93.7 /100 | #123 | Exceptional 11.8% |
| Ugandans | 93.1 /100 | #124 | Exceptional 11.8% |
| Ukrainians | 92.3 /100 | #125 | Exceptional 11.8% |
| South American Indians | 92.1 /100 | #126 | Exceptional 11.8% |
| South Africans | 88.9 /100 | #127 | Excellent 11.8% |
| Immigrants | Ecuador | 88.9 /100 | #128 | Excellent 11.8% |
| Immigrants | St. Vincent and the Grenadines | 88.4 /100 | #129 | Excellent 11.8% |
| Immigrants | Austria | 88.2 /100 | #130 | Excellent 11.8% |