Pakistani vs Immigrants Divorced or Separated
COMPARE
Pakistani
Immigrants
Divorced or Separated
Divorced or Separated Comparison
Pakistanis
Immigrants
11.9%
DIVORCED OR SEPARATED
81.3/ 100
METRIC RATING
143rd/ 347
METRIC RANK
11.8%
DIVORCED OR SEPARATED
93.7/ 100
METRIC RATING
123rd/ 347
METRIC RANK
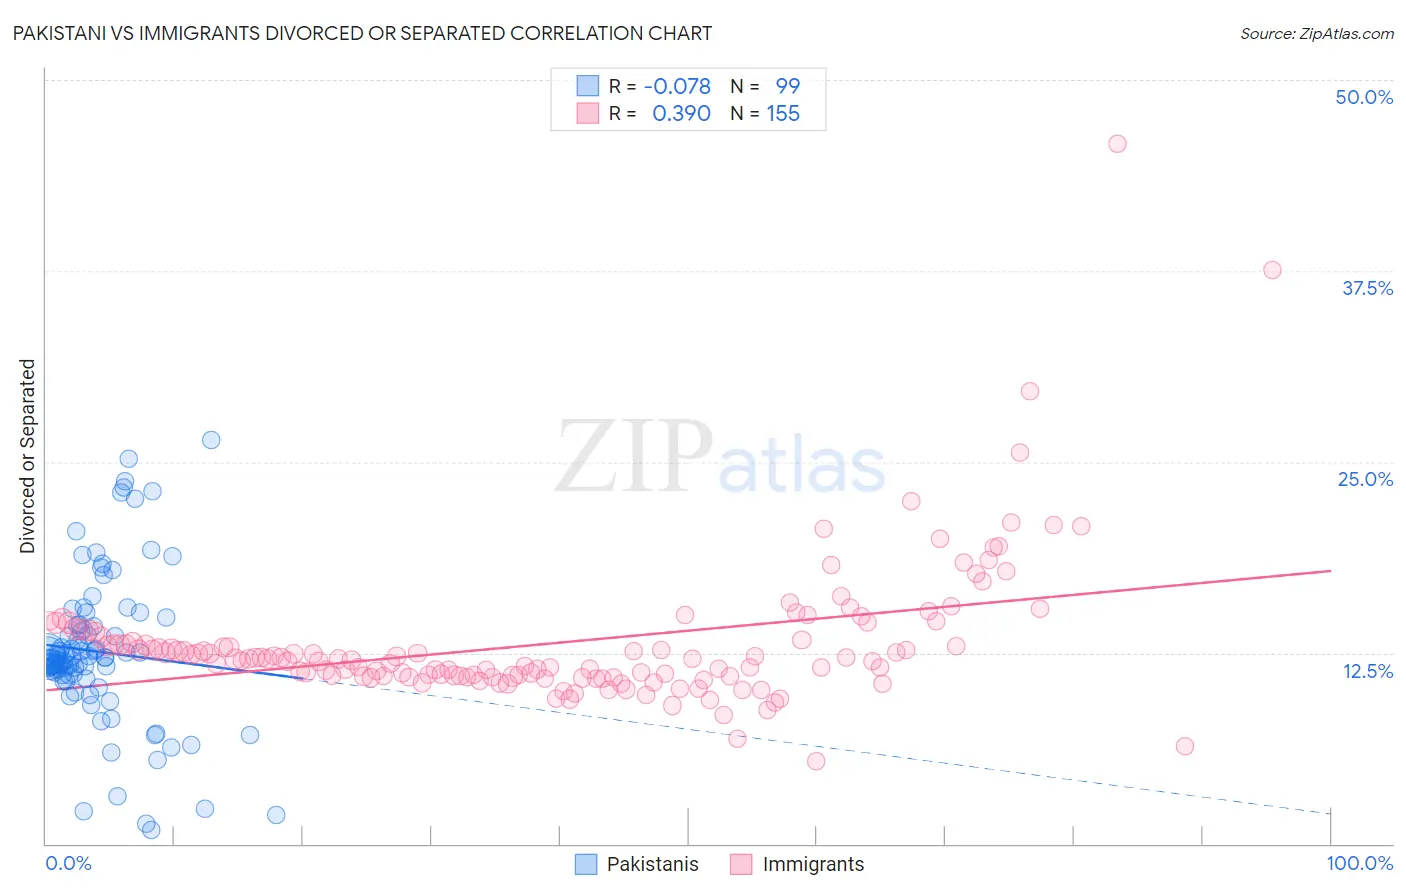
Pakistani vs Immigrants Divorced or Separated Correlation Chart
The statistical analysis conducted on geographies consisting of 335,267,594 people shows a slight negative correlation between the proportion of Pakistanis and percentage of population currently divorced or separated in the United States with a correlation coefficient (R) of -0.078 and weighted average of 11.9%. Similarly, the statistical analysis conducted on geographies consisting of 577,228,923 people shows a mild positive correlation between the proportion of Immigrants and percentage of population currently divorced or separated in the United States with a correlation coefficient (R) of 0.390 and weighted average of 11.8%, a difference of 1.1%.
Divorced or Separated Correlation Summary
| Measurement | Pakistani | Immigrants |
| Minimum | 0.90% | 5.4% |
| Maximum | 26.4% | 45.8% |
| Range | 25.5% | 40.4% |
| Mean | 12.6% | 13.1% |
| Median | 12.1% | 12.1% |
| Interquartile 25% (IQ1) | 11.0% | 10.9% |
| Interquartile 75% (IQ3) | 14.3% | 13.5% |
| Interquartile Range (IQR) | 3.2% | 2.6% |
| Standard Deviation (Sample) | 4.9% | 4.7% |
| Standard Deviation (Population) | 4.9% | 4.7% |
Demographics Similar to Pakistanis and Immigrants by Divorced or Separated
In terms of divorced or separated, the demographic groups most similar to Pakistanis are Immigrants from Zimbabwe (11.9%, a difference of 0.010%), Immigrants from Morocco (11.9%, a difference of 0.090%), Lebanese (11.9%, a difference of 0.12%), Australian (11.9%, a difference of 0.14%), and Alsatian (11.9%, a difference of 0.16%). Similarly, the demographic groups most similar to Immigrants are Ugandan (11.8%, a difference of 0.080%), Ukrainian (11.8%, a difference of 0.19%), South American Indian (11.8%, a difference of 0.21%), South African (11.8%, a difference of 0.55%), and Immigrants from Ecuador (11.8%, a difference of 0.55%).
| Demographics | Rating | Rank | Divorced or Separated |
| Immigrants | Immigrants | 93.7 /100 | #123 | Exceptional 11.8% |
| Ugandans | 93.1 /100 | #124 | Exceptional 11.8% |
| Ukrainians | 92.3 /100 | #125 | Exceptional 11.8% |
| South American Indians | 92.1 /100 | #126 | Exceptional 11.8% |
| South Africans | 88.9 /100 | #127 | Excellent 11.8% |
| Immigrants | Ecuador | 88.9 /100 | #128 | Excellent 11.8% |
| Immigrants | St. Vincent and the Grenadines | 88.4 /100 | #129 | Excellent 11.8% |
| Immigrants | Austria | 88.2 /100 | #130 | Excellent 11.8% |
| Immigrants | Cambodia | 88.2 /100 | #131 | Excellent 11.8% |
| Immigrants | Afghanistan | 87.9 /100 | #132 | Excellent 11.8% |
| New Zealanders | 87.5 /100 | #133 | Excellent 11.9% |
| Argentineans | 85.1 /100 | #134 | Excellent 11.9% |
| Danes | 84.8 /100 | #135 | Excellent 11.9% |
| Carpatho Rusyns | 84.8 /100 | #136 | Excellent 11.9% |
| Alsatians | 84.0 /100 | #137 | Excellent 11.9% |
| Immigrants | Netherlands | 83.9 /100 | #138 | Excellent 11.9% |
| Australians | 83.6 /100 | #139 | Excellent 11.9% |
| Lebanese | 83.4 /100 | #140 | Excellent 11.9% |
| Immigrants | Morocco | 82.9 /100 | #141 | Excellent 11.9% |
| Immigrants | Zimbabwe | 81.5 /100 | #142 | Excellent 11.9% |
| Pakistanis | 81.3 /100 | #143 | Excellent 11.9% |