Immigrants from Norway vs Immigrants from Uzbekistan Divorced or Separated
COMPARE
Immigrants from Norway
Immigrants from Uzbekistan
Divorced or Separated
Divorced or Separated Comparison
Immigrants from Norway
Immigrants from Uzbekistan
11.7%
DIVORCED OR SEPARATED
95.9/ 100
METRIC RATING
114th/ 347
METRIC RANK
11.1%
DIVORCED OR SEPARATED
100.0/ 100
METRIC RATING
34th/ 347
METRIC RANK
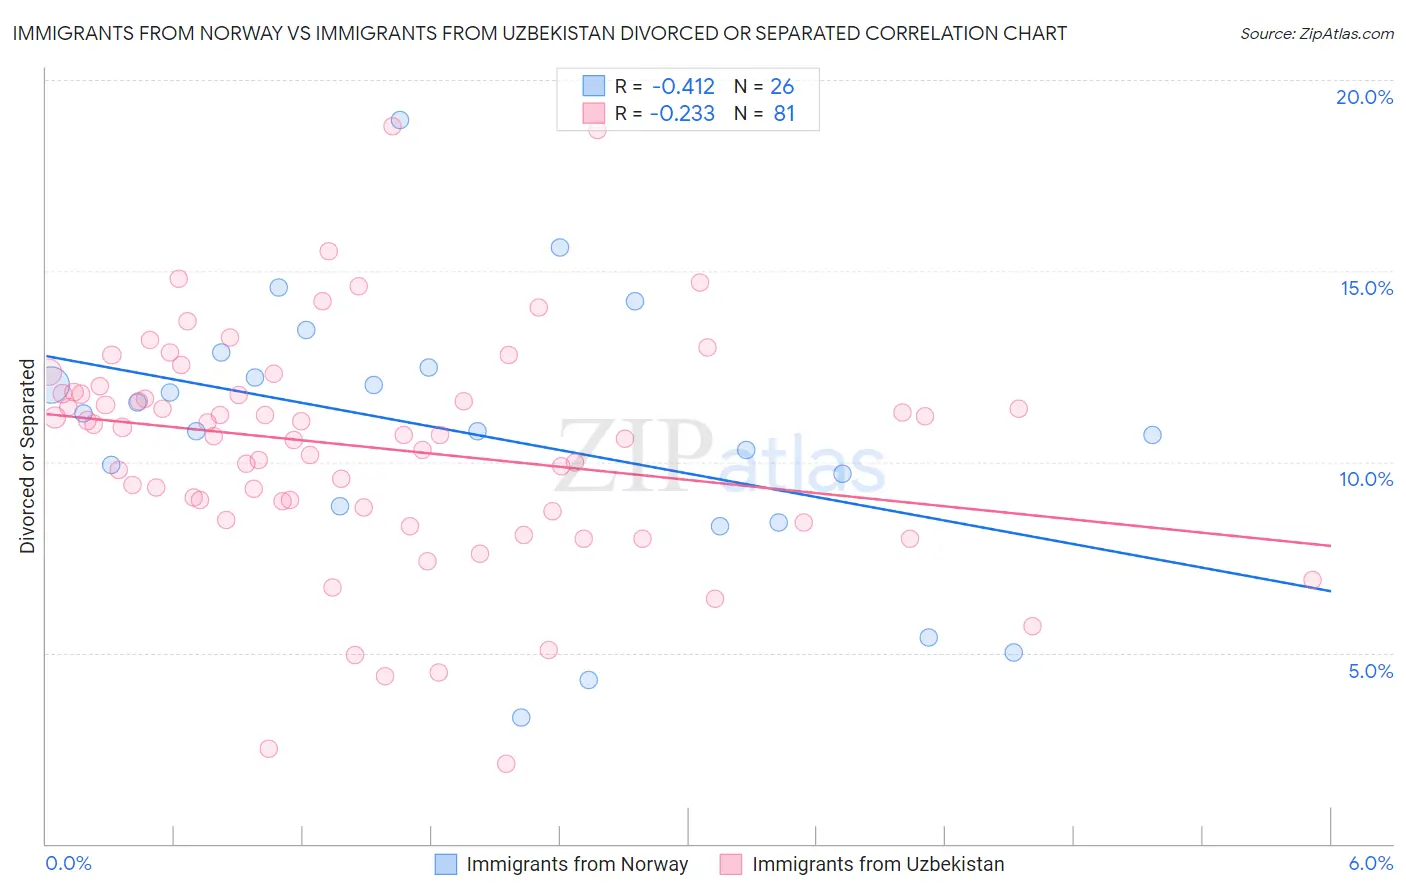
Immigrants from Norway vs Immigrants from Uzbekistan Divorced or Separated Correlation Chart
The statistical analysis conducted on geographies consisting of 116,710,003 people shows a moderate negative correlation between the proportion of Immigrants from Norway and percentage of population currently divorced or separated in the United States with a correlation coefficient (R) of -0.412 and weighted average of 11.7%. Similarly, the statistical analysis conducted on geographies consisting of 118,737,303 people shows a weak negative correlation between the proportion of Immigrants from Uzbekistan and percentage of population currently divorced or separated in the United States with a correlation coefficient (R) of -0.233 and weighted average of 11.1%, a difference of 5.8%.
Divorced or Separated Correlation Summary
| Measurement | Immigrants from Norway | Immigrants from Uzbekistan |
| Minimum | 3.3% | 2.1% |
| Maximum | 18.9% | 18.8% |
| Range | 15.6% | 16.7% |
| Mean | 10.7% | 10.4% |
| Median | 11.0% | 10.7% |
| Interquartile 25% (IQ1) | 8.8% | 8.7% |
| Interquartile 75% (IQ3) | 12.5% | 11.8% |
| Interquartile Range (IQR) | 3.6% | 3.1% |
| Standard Deviation (Sample) | 3.6% | 3.0% |
| Standard Deviation (Population) | 3.5% | 3.0% |
Similar Demographics by Divorced or Separated
Demographics Similar to Immigrants from Norway by Divorced or Separated
In terms of divorced or separated, the demographic groups most similar to Immigrants from Norway are Lithuanian (11.7%, a difference of 0.050%), Immigrants from Iraq (11.7%, a difference of 0.12%), Immigrants from Uganda (11.7%, a difference of 0.13%), Ecuadorian (11.7%, a difference of 0.14%), and Immigrants from France (11.7%, a difference of 0.17%).
| Demographics | Rating | Rank | Divorced or Separated |
| Native Hawaiians | 97.2 /100 | #107 | Exceptional 11.7% |
| Greeks | 96.9 /100 | #108 | Exceptional 11.7% |
| Immigrants | South Africa | 96.9 /100 | #109 | Exceptional 11.7% |
| Immigrants | Czechoslovakia | 96.9 /100 | #110 | Exceptional 11.7% |
| Immigrants | Spain | 96.8 /100 | #111 | Exceptional 11.7% |
| Immigrants | France | 96.6 /100 | #112 | Exceptional 11.7% |
| Estonians | 96.6 /100 | #113 | Exceptional 11.7% |
| Immigrants | Norway | 95.9 /100 | #114 | Exceptional 11.7% |
| Lithuanians | 95.7 /100 | #115 | Exceptional 11.7% |
| Immigrants | Iraq | 95.4 /100 | #116 | Exceptional 11.7% |
| Immigrants | Uganda | 95.3 /100 | #117 | Exceptional 11.7% |
| Ecuadorians | 95.3 /100 | #118 | Exceptional 11.7% |
| Syrians | 95.1 /100 | #119 | Exceptional 11.7% |
| Iraqis | 94.6 /100 | #120 | Exceptional 11.8% |
| Romanians | 94.5 /100 | #121 | Exceptional 11.8% |
Demographics Similar to Immigrants from Uzbekistan by Divorced or Separated
In terms of divorced or separated, the demographic groups most similar to Immigrants from Uzbekistan are Egyptian (11.1%, a difference of 0.070%), Cambodian (11.1%, a difference of 0.080%), Tongan (11.1%, a difference of 0.12%), Immigrants from Japan (11.1%, a difference of 0.14%), and Immigrants from Lebanon (11.1%, a difference of 0.15%).
| Demographics | Rating | Rank | Divorced or Separated |
| Immigrants | Bangladesh | 100.0 /100 | #27 | Exceptional 11.0% |
| Immigrants | Malaysia | 100.0 /100 | #28 | Exceptional 11.0% |
| Armenians | 100.0 /100 | #29 | Exceptional 11.0% |
| Immigrants | Ireland | 100.0 /100 | #30 | Exceptional 11.0% |
| Mongolians | 100.0 /100 | #31 | Exceptional 11.1% |
| Tongans | 100.0 /100 | #32 | Exceptional 11.1% |
| Egyptians | 100.0 /100 | #33 | Exceptional 11.1% |
| Immigrants | Uzbekistan | 100.0 /100 | #34 | Exceptional 11.1% |
| Cambodians | 100.0 /100 | #35 | Exceptional 11.1% |
| Immigrants | Japan | 100.0 /100 | #36 | Exceptional 11.1% |
| Immigrants | Lebanon | 100.0 /100 | #37 | Exceptional 11.1% |
| Immigrants | Greece | 100.0 /100 | #38 | Exceptional 11.1% |
| Immigrants | Egypt | 100.0 /100 | #39 | Exceptional 11.1% |
| Soviet Union | 100.0 /100 | #40 | Exceptional 11.1% |
| Bhutanese | 100.0 /100 | #41 | Exceptional 11.2% |