Immigrants from Eastern Asia vs Czech Family Households
COMPARE
Immigrants from Eastern Asia
Czech
Family Households
Family Households Comparison
Immigrants from Eastern Asia
Czechs
64.9%
FAMILY HOUSEHOLDS
94.4/ 100
METRIC RATING
119th/ 347
METRIC RANK
64.5%
FAMILY HOUSEHOLDS
67.0/ 100
METRIC RATING
156th/ 347
METRIC RANK
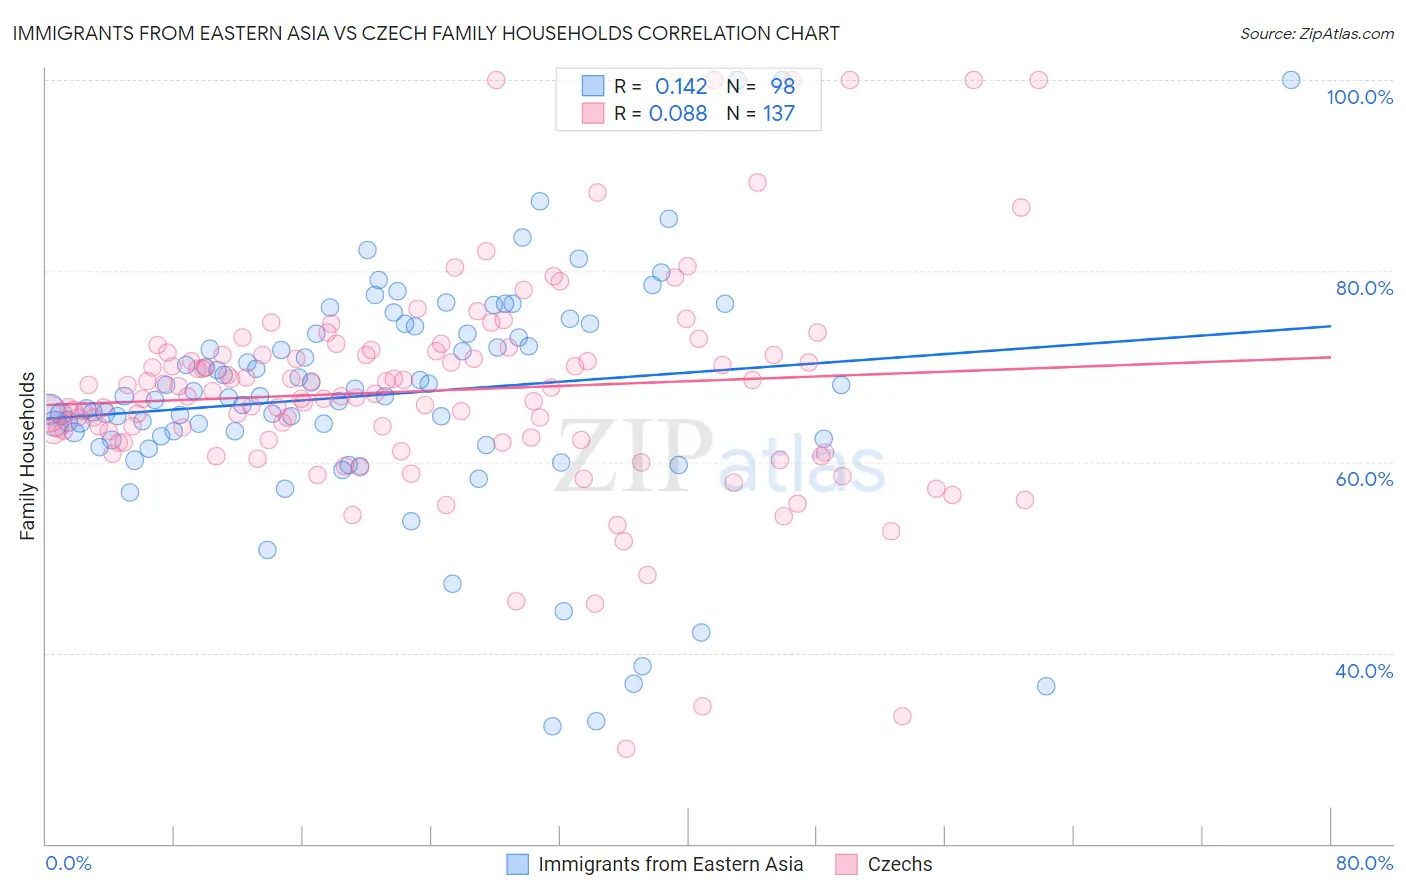
Immigrants from Eastern Asia vs Czech Family Households Correlation Chart
The statistical analysis conducted on geographies consisting of 499,398,554 people shows a poor positive correlation between the proportion of Immigrants from Eastern Asia and percentage of family households in the United States with a correlation coefficient (R) of 0.142 and weighted average of 64.9%. Similarly, the statistical analysis conducted on geographies consisting of 484,475,433 people shows a slight positive correlation between the proportion of Czechs and percentage of family households in the United States with a correlation coefficient (R) of 0.088 and weighted average of 64.5%, a difference of 0.71%.
Family Households Correlation Summary
| Measurement | Immigrants from Eastern Asia | Czech |
| Minimum | 32.3% | 29.9% |
| Maximum | 100.0% | 100.0% |
| Range | 67.7% | 70.1% |
| Mean | 67.0% | 67.4% |
| Median | 66.8% | 66.9% |
| Interquartile 25% (IQ1) | 62.7% | 62.2% |
| Interquartile 75% (IQ3) | 73.5% | 71.4% |
| Interquartile Range (IQR) | 10.8% | 9.2% |
| Standard Deviation (Sample) | 12.2% | 11.4% |
| Standard Deviation (Population) | 12.1% | 11.3% |
Similar Demographics by Family Households
Demographics Similar to Immigrants from Eastern Asia by Family Households
In terms of family households, the demographic groups most similar to Immigrants from Eastern Asia are Immigrants from Oceania (64.9%, a difference of 0.010%), Hungarian (64.9%, a difference of 0.020%), Dutch (64.9%, a difference of 0.040%), Cherokee (65.0%, a difference of 0.060%), and Hmong (64.9%, a difference of 0.060%).
| Demographics | Rating | Rank | Family Households |
| Immigrants | Jordan | 96.5 /100 | #112 | Exceptional 65.0% |
| Spanish | 96.2 /100 | #113 | Exceptional 65.0% |
| Argentineans | 95.7 /100 | #114 | Exceptional 65.0% |
| Ecuadorians | 95.4 /100 | #115 | Exceptional 65.0% |
| Immigrants | Iraq | 95.4 /100 | #116 | Exceptional 65.0% |
| Cherokee | 95.3 /100 | #117 | Exceptional 65.0% |
| Dutch | 95.1 /100 | #118 | Exceptional 64.9% |
| Immigrants | Eastern Asia | 94.4 /100 | #119 | Exceptional 64.9% |
| Immigrants | Oceania | 94.2 /100 | #120 | Exceptional 64.9% |
| Hungarians | 94.0 /100 | #121 | Exceptional 64.9% |
| Hmong | 93.4 /100 | #122 | Exceptional 64.9% |
| Choctaw | 93.4 /100 | #123 | Exceptional 64.9% |
| Immigrants | Argentina | 92.8 /100 | #124 | Exceptional 64.9% |
| Immigrants | Belize | 92.7 /100 | #125 | Exceptional 64.9% |
| Panamanians | 92.4 /100 | #126 | Exceptional 64.8% |
Demographics Similar to Czechs by Family Households
In terms of family households, the demographic groups most similar to Czechs are Uruguayan (64.5%, a difference of 0.010%), Canadian (64.4%, a difference of 0.010%), Lebanese (64.4%, a difference of 0.010%), Austrian (64.5%, a difference of 0.020%), and German (64.4%, a difference of 0.020%).
| Demographics | Rating | Rank | Family Households |
| Sioux | 76.3 /100 | #149 | Good 64.6% |
| Romanians | 75.3 /100 | #150 | Good 64.5% |
| Syrians | 75.2 /100 | #151 | Good 64.5% |
| Scottish | 70.9 /100 | #152 | Good 64.5% |
| Swedes | 69.8 /100 | #153 | Good 64.5% |
| Austrians | 68.5 /100 | #154 | Good 64.5% |
| Uruguayans | 67.7 /100 | #155 | Good 64.5% |
| Czechs | 67.0 /100 | #156 | Good 64.5% |
| Canadians | 66.6 /100 | #157 | Good 64.4% |
| Lebanese | 66.4 /100 | #158 | Good 64.4% |
| Germans | 65.8 /100 | #159 | Good 64.4% |
| Immigrants | Moldova | 65.2 /100 | #160 | Good 64.4% |
| Immigrants | England | 62.6 /100 | #161 | Good 64.4% |
| British | 61.6 /100 | #162 | Good 64.4% |
| Chickasaw | 61.5 /100 | #163 | Good 64.4% |