Immigrants from North Macedonia vs Immigrants from Jamaica Unemployment Among Women with Children Ages 6 to 17 years
COMPARE
Immigrants from North Macedonia
Immigrants from Jamaica
Unemployment Among Women with Children Ages 6 to 17 years
Unemployment Among Women with Children Ages 6 to 17 years Comparison
Immigrants from North Macedonia
Immigrants from Jamaica
8.5%
UNEMPLOYMENT AMONG WOMEN WITH CHILDREN AGES 6 TO 17 YEARS
99.4/ 100
METRIC RATING
85th/ 347
METRIC RANK
9.5%
UNEMPLOYMENT AMONG WOMEN WITH CHILDREN AGES 6 TO 17 YEARS
0.3/ 100
METRIC RATING
266th/ 347
METRIC RANK
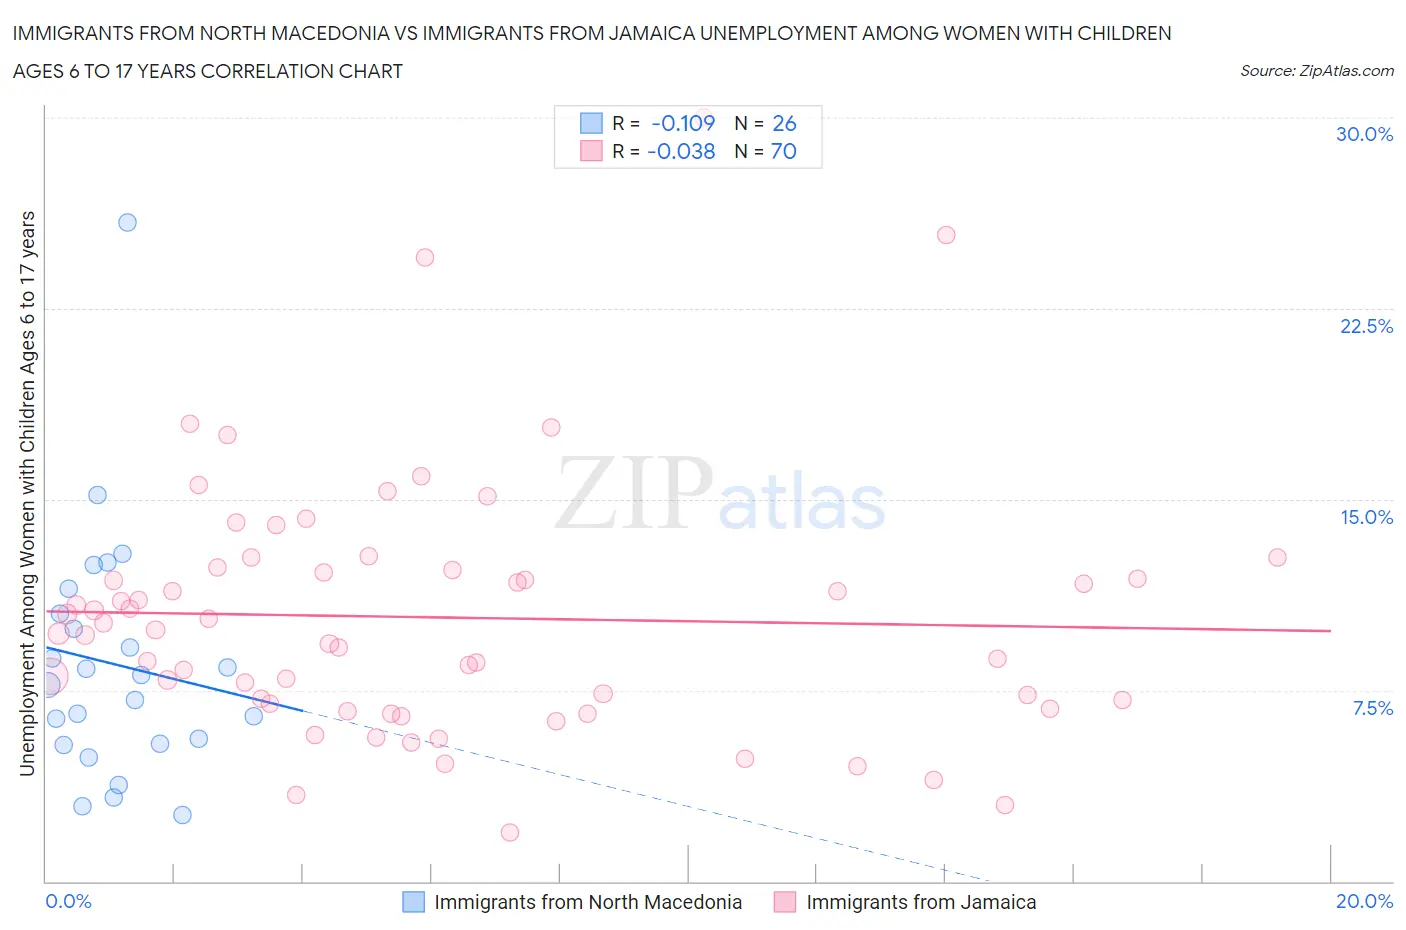
Immigrants from North Macedonia vs Immigrants from Jamaica Unemployment Among Women with Children Ages 6 to 17 years Correlation Chart
The statistical analysis conducted on geographies consisting of 63,088,310 people shows a poor negative correlation between the proportion of Immigrants from North Macedonia and unemployment rate among women with children between the ages 6 and 17 in the United States with a correlation coefficient (R) of -0.109 and weighted average of 8.5%. Similarly, the statistical analysis conducted on geographies consisting of 232,133,917 people shows no correlation between the proportion of Immigrants from Jamaica and unemployment rate among women with children between the ages 6 and 17 in the United States with a correlation coefficient (R) of -0.038 and weighted average of 9.5%, a difference of 12.9%.
Unemployment Among Women with Children Ages 6 to 17 years Correlation Summary
| Measurement | Immigrants from North Macedonia | Immigrants from Jamaica |
| Minimum | 2.6% | 1.9% |
| Maximum | 25.9% | 30.0% |
| Range | 23.3% | 28.1% |
| Mean | 8.5% | 10.4% |
| Median | 7.9% | 9.8% |
| Interquartile 25% (IQ1) | 5.4% | 7.0% |
| Interquartile 75% (IQ3) | 10.5% | 12.2% |
| Interquartile Range (IQR) | 5.1% | 5.3% |
| Standard Deviation (Sample) | 4.8% | 5.0% |
| Standard Deviation (Population) | 4.7% | 5.0% |
Similar Demographics by Unemployment Among Women with Children Ages 6 to 17 years
Demographics Similar to Immigrants from North Macedonia by Unemployment Among Women with Children Ages 6 to 17 years
In terms of unemployment among women with children ages 6 to 17 years, the demographic groups most similar to Immigrants from North Macedonia are Japanese (8.4%, a difference of 0.040%), Alaskan Athabascan (8.5%, a difference of 0.15%), Bulgarian (8.4%, a difference of 0.16%), Cypriot (8.4%, a difference of 0.32%), and Immigrants from Bolivia (8.4%, a difference of 0.34%).
| Demographics | Rating | Rank | Unemployment Among Women with Children Ages 6 to 17 years |
| Pakistanis | 99.6 /100 | #78 | Exceptional 8.4% |
| Mongolians | 99.6 /100 | #79 | Exceptional 8.4% |
| Immigrants | Belarus | 99.6 /100 | #80 | Exceptional 8.4% |
| Immigrants | Bolivia | 99.6 /100 | #81 | Exceptional 8.4% |
| Cypriots | 99.6 /100 | #82 | Exceptional 8.4% |
| Bulgarians | 99.5 /100 | #83 | Exceptional 8.4% |
| Japanese | 99.5 /100 | #84 | Exceptional 8.4% |
| Immigrants | North Macedonia | 99.4 /100 | #85 | Exceptional 8.5% |
| Alaskan Athabascans | 99.4 /100 | #86 | Exceptional 8.5% |
| Immigrants | Israel | 99.1 /100 | #87 | Exceptional 8.5% |
| Immigrants | Vietnam | 99.1 /100 | #88 | Exceptional 8.5% |
| Paiute | 99.1 /100 | #89 | Exceptional 8.5% |
| Yugoslavians | 99.0 /100 | #90 | Exceptional 8.5% |
| Immigrants | Eastern Europe | 99.0 /100 | #91 | Exceptional 8.5% |
| Potawatomi | 99.0 /100 | #92 | Exceptional 8.5% |
Demographics Similar to Immigrants from Jamaica by Unemployment Among Women with Children Ages 6 to 17 years
In terms of unemployment among women with children ages 6 to 17 years, the demographic groups most similar to Immigrants from Jamaica are Irish (9.5%, a difference of 0.020%), West Indian (9.5%, a difference of 0.16%), Immigrants from Ghana (9.5%, a difference of 0.20%), Ghanaian (9.6%, a difference of 0.41%), and Lebanese (9.5%, a difference of 0.44%).
| Demographics | Rating | Rank | Unemployment Among Women with Children Ages 6 to 17 years |
| Immigrants | Central America | 0.6 /100 | #259 | Tragic 9.5% |
| Italians | 0.6 /100 | #260 | Tragic 9.5% |
| South Americans | 0.5 /100 | #261 | Tragic 9.5% |
| Senegalese | 0.5 /100 | #262 | Tragic 9.5% |
| Lebanese | 0.5 /100 | #263 | Tragic 9.5% |
| Immigrants | Ghana | 0.4 /100 | #264 | Tragic 9.5% |
| West Indians | 0.4 /100 | #265 | Tragic 9.5% |
| Immigrants | Jamaica | 0.3 /100 | #266 | Tragic 9.5% |
| Irish | 0.3 /100 | #267 | Tragic 9.5% |
| Ghanaians | 0.2 /100 | #268 | Tragic 9.6% |
| Blackfeet | 0.2 /100 | #269 | Tragic 9.6% |
| Immigrants | Nicaragua | 0.2 /100 | #270 | Tragic 9.6% |
| Immigrants | Latin America | 0.1 /100 | #271 | Tragic 9.6% |
| Kiowa | 0.1 /100 | #272 | Tragic 9.6% |
| Whites/Caucasians | 0.1 /100 | #273 | Tragic 9.6% |