Immigrants from Moldova vs Hmong Single Mother Households
COMPARE
Immigrants from Moldova
Hmong
Single Mother Households
Single Mother Households Comparison
Immigrants from Moldova
Hmong
5.6%
SINGLE MOTHER HOUSEHOLDS
97.9/ 100
METRIC RATING
81st/ 347
METRIC RANK
6.4%
SINGLE MOTHER HOUSEHOLDS
39.8/ 100
METRIC RATING
179th/ 347
METRIC RANK
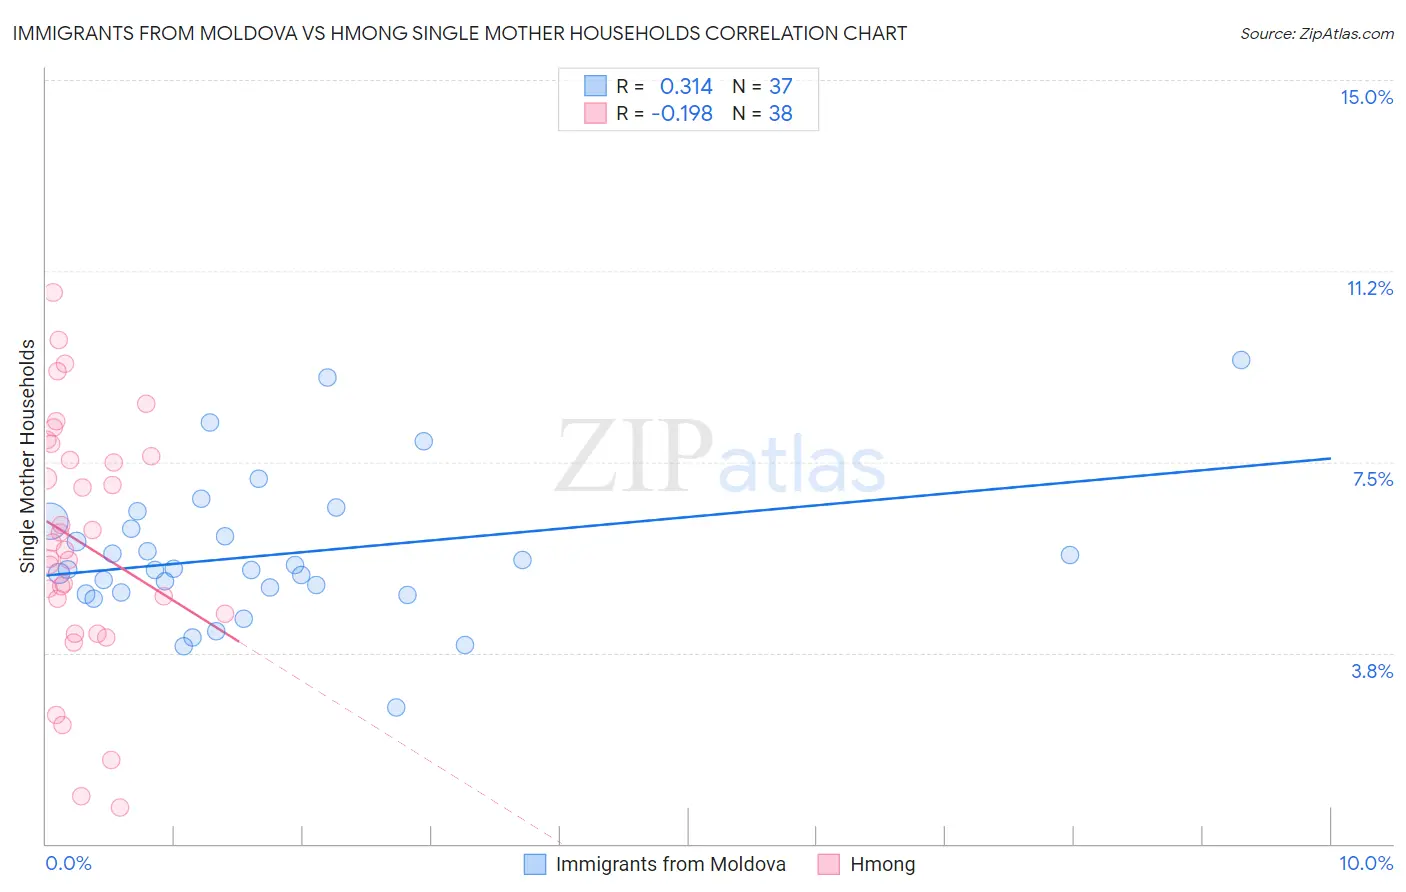
Immigrants from Moldova vs Hmong Single Mother Households Correlation Chart
The statistical analysis conducted on geographies consisting of 124,294,773 people shows a mild positive correlation between the proportion of Immigrants from Moldova and percentage of single mother households in the United States with a correlation coefficient (R) of 0.314 and weighted average of 5.6%. Similarly, the statistical analysis conducted on geographies consisting of 24,669,739 people shows a poor negative correlation between the proportion of Hmong and percentage of single mother households in the United States with a correlation coefficient (R) of -0.198 and weighted average of 6.4%, a difference of 13.0%.
Single Mother Households Correlation Summary
| Measurement | Immigrants from Moldova | Hmong |
| Minimum | 2.7% | 0.72% |
| Maximum | 9.5% | 10.8% |
| Range | 6.8% | 10.1% |
| Mean | 5.7% | 5.9% |
| Median | 5.4% | 5.8% |
| Interquartile 25% (IQ1) | 4.9% | 4.5% |
| Interquartile 75% (IQ3) | 6.3% | 7.6% |
| Interquartile Range (IQR) | 1.3% | 3.1% |
| Standard Deviation (Sample) | 1.4% | 2.4% |
| Standard Deviation (Population) | 1.4% | 2.4% |
Similar Demographics by Single Mother Households
Demographics Similar to Immigrants from Moldova by Single Mother Households
In terms of single mother households, the demographic groups most similar to Immigrants from Moldova are Czech (5.6%, a difference of 0.0%), Immigrants from Sri Lanka (5.6%, a difference of 0.11%), Immigrants from Malaysia (5.7%, a difference of 0.21%), Immigrants from Hungary (5.7%, a difference of 0.24%), and Swiss (5.6%, a difference of 0.31%).
| Demographics | Rating | Rank | Single Mother Households |
| Immigrants | North America | 98.3 /100 | #74 | Exceptional 5.6% |
| Slovenes | 98.3 /100 | #75 | Exceptional 5.6% |
| New Zealanders | 98.2 /100 | #76 | Exceptional 5.6% |
| Romanians | 98.1 /100 | #77 | Exceptional 5.6% |
| Swiss | 98.1 /100 | #78 | Exceptional 5.6% |
| Immigrants | Sri Lanka | 98.0 /100 | #79 | Exceptional 5.6% |
| Czechs | 97.9 /100 | #80 | Exceptional 5.6% |
| Immigrants | Moldova | 97.9 /100 | #81 | Exceptional 5.6% |
| Immigrants | Malaysia | 97.8 /100 | #82 | Exceptional 5.7% |
| Immigrants | Hungary | 97.8 /100 | #83 | Exceptional 5.7% |
| Carpatho Rusyns | 97.7 /100 | #84 | Exceptional 5.7% |
| Hungarians | 97.6 /100 | #85 | Exceptional 5.7% |
| Finns | 97.6 /100 | #86 | Exceptional 5.7% |
| Immigrants | Turkey | 97.5 /100 | #87 | Exceptional 5.7% |
| Israelis | 97.4 /100 | #88 | Exceptional 5.7% |
Demographics Similar to Hmong by Single Mother Households
In terms of single mother households, the demographic groups most similar to Hmong are Portuguese (6.4%, a difference of 0.020%), Osage (6.4%, a difference of 0.36%), Immigrants from Nepal (6.4%, a difference of 0.43%), Immigrants from Bosnia and Herzegovina (6.3%, a difference of 0.51%), and Marshallese (6.3%, a difference of 0.67%).
| Demographics | Rating | Rank | Single Mother Households |
| Immigrants | South Eastern Asia | 52.2 /100 | #172 | Average 6.3% |
| Immigrants | Vietnam | 51.5 /100 | #173 | Average 6.3% |
| Immigrants | Morocco | 50.0 /100 | #174 | Average 6.3% |
| Marshallese | 45.8 /100 | #175 | Average 6.3% |
| Immigrants | Bosnia and Herzegovina | 44.3 /100 | #176 | Average 6.3% |
| Osage | 43.0 /100 | #177 | Average 6.4% |
| Portuguese | 40.0 /100 | #178 | Fair 6.4% |
| Hmong | 39.8 /100 | #179 | Fair 6.4% |
| Immigrants | Nepal | 36.1 /100 | #180 | Fair 6.4% |
| Spanish | 33.4 /100 | #181 | Fair 6.4% |
| South American Indians | 33.4 /100 | #182 | Fair 6.4% |
| Spaniards | 27.8 /100 | #183 | Fair 6.5% |
| Ethiopians | 26.0 /100 | #184 | Fair 6.5% |
| Ugandans | 25.6 /100 | #185 | Fair 6.5% |
| Costa Ricans | 24.8 /100 | #186 | Fair 6.5% |