Immigrants from Morocco vs Tongan Currently Married
COMPARE
Immigrants from Morocco
Tongan
Currently Married
Currently Married Comparison
Immigrants from Morocco
Tongans
45.4%
CURRENTLY MARRIED
5.5/ 100
METRIC RATING
216th/ 347
METRIC RANK
48.3%
CURRENTLY MARRIED
98.2/ 100
METRIC RATING
66th/ 347
METRIC RANK
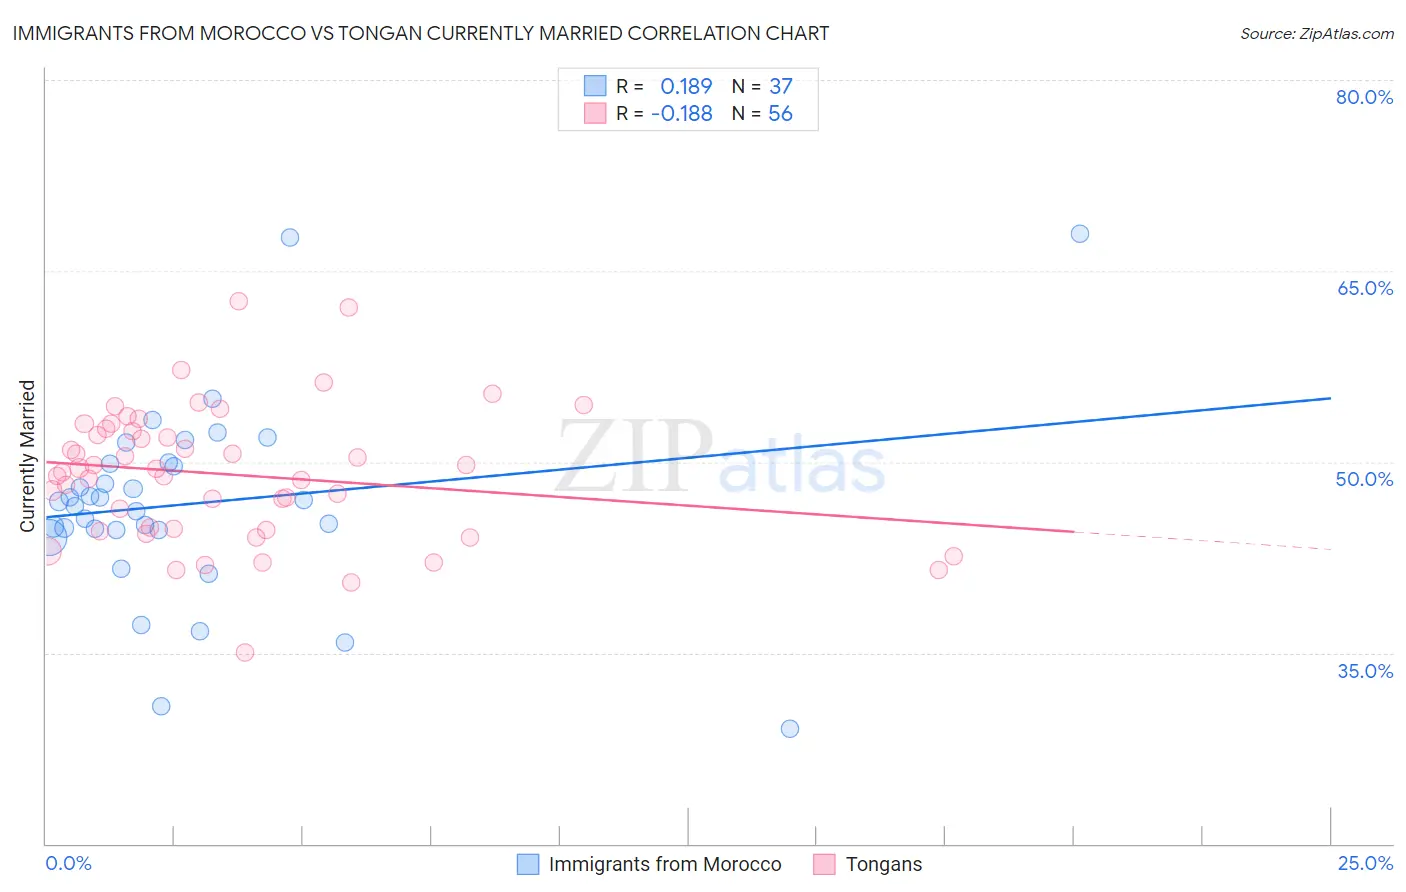
Immigrants from Morocco vs Tongan Currently Married Correlation Chart
The statistical analysis conducted on geographies consisting of 178,912,438 people shows a poor positive correlation between the proportion of Immigrants from Morocco and percentage of population currently married in the United States with a correlation coefficient (R) of 0.189 and weighted average of 45.4%. Similarly, the statistical analysis conducted on geographies consisting of 102,907,109 people shows a poor negative correlation between the proportion of Tongans and percentage of population currently married in the United States with a correlation coefficient (R) of -0.188 and weighted average of 48.3%, a difference of 6.4%.
Currently Married Correlation Summary
| Measurement | Immigrants from Morocco | Tongan |
| Minimum | 29.0% | 35.0% |
| Maximum | 67.9% | 62.6% |
| Range | 38.9% | 27.6% |
| Mean | 46.7% | 49.0% |
| Median | 46.9% | 49.3% |
| Interquartile 25% (IQ1) | 44.6% | 44.7% |
| Interquartile 75% (IQ3) | 49.9% | 52.5% |
| Interquartile Range (IQR) | 5.3% | 7.8% |
| Standard Deviation (Sample) | 7.6% | 5.3% |
| Standard Deviation (Population) | 7.5% | 5.3% |
Similar Demographics by Currently Married
Demographics Similar to Immigrants from Morocco by Currently Married
In terms of currently married, the demographic groups most similar to Immigrants from Morocco are Immigrants from Thailand (45.4%, a difference of 0.080%), Dutch West Indian (45.5%, a difference of 0.20%), German Russian (45.5%, a difference of 0.20%), Alaska Native (45.5%, a difference of 0.24%), and Houma (45.5%, a difference of 0.27%).
| Demographics | Rating | Rank | Currently Married |
| Immigrants | Micronesia | 8.8 /100 | #209 | Tragic 45.6% |
| Uruguayans | 7.9 /100 | #210 | Tragic 45.6% |
| Houma | 7.2 /100 | #211 | Tragic 45.5% |
| Marshallese | 7.2 /100 | #212 | Tragic 45.5% |
| Alaska Natives | 7.0 /100 | #213 | Tragic 45.5% |
| Dutch West Indians | 6.7 /100 | #214 | Tragic 45.5% |
| German Russians | 6.7 /100 | #215 | Tragic 45.5% |
| Immigrants | Morocco | 5.5 /100 | #216 | Tragic 45.4% |
| Immigrants | Thailand | 5.1 /100 | #217 | Tragic 45.4% |
| Panamanians | 4.0 /100 | #218 | Tragic 45.3% |
| Immigrants | Portugal | 3.5 /100 | #219 | Tragic 45.2% |
| Kenyans | 3.1 /100 | #220 | Tragic 45.2% |
| Mexicans | 3.0 /100 | #221 | Tragic 45.2% |
| Immigrants | Azores | 2.5 /100 | #222 | Tragic 45.1% |
| Immigrants | Laos | 2.3 /100 | #223 | Tragic 45.0% |
Demographics Similar to Tongans by Currently Married
In terms of currently married, the demographic groups most similar to Tongans are Slovak (48.3%, a difference of 0.010%), Immigrants from England (48.3%, a difference of 0.020%), Immigrants from Czechoslovakia (48.4%, a difference of 0.030%), Ukrainian (48.4%, a difference of 0.030%), and Slavic (48.4%, a difference of 0.040%).
| Demographics | Rating | Rank | Currently Married |
| Immigrants | Ireland | 98.5 /100 | #59 | Exceptional 48.4% |
| Immigrants | Romania | 98.5 /100 | #60 | Exceptional 48.4% |
| Romanians | 98.5 /100 | #61 | Exceptional 48.4% |
| Asians | 98.5 /100 | #62 | Exceptional 48.4% |
| Slavs | 98.3 /100 | #63 | Exceptional 48.4% |
| Immigrants | Czechoslovakia | 98.3 /100 | #64 | Exceptional 48.4% |
| Ukrainians | 98.3 /100 | #65 | Exceptional 48.4% |
| Tongans | 98.2 /100 | #66 | Exceptional 48.3% |
| Slovaks | 98.2 /100 | #67 | Exceptional 48.3% |
| Immigrants | England | 98.2 /100 | #68 | Exceptional 48.3% |
| Canadians | 98.1 /100 | #69 | Exceptional 48.3% |
| Immigrants | Asia | 97.9 /100 | #70 | Exceptional 48.3% |
| Macedonians | 97.9 /100 | #71 | Exceptional 48.3% |
| Immigrants | Lebanon | 97.6 /100 | #72 | Exceptional 48.2% |
| Immigrants | Eastern Asia | 97.5 /100 | #73 | Exceptional 48.2% |