Immigrants from Morocco vs Alsatian Unemployment Among Ages 30 to 34 years
COMPARE
Immigrants from Morocco
Alsatian
Unemployment Among Ages 30 to 34 years
Unemployment Among Ages 30 to 34 years Comparison
Immigrants from Morocco
Alsatians
5.1%
UNEMPLOYMENT AMONG AGES 30 TO 34 YEARS
97.9/ 100
METRIC RATING
54th/ 347
METRIC RANK
5.6%
UNEMPLOYMENT AMONG AGES 30 TO 34 YEARS
14.3/ 100
METRIC RATING
206th/ 347
METRIC RANK
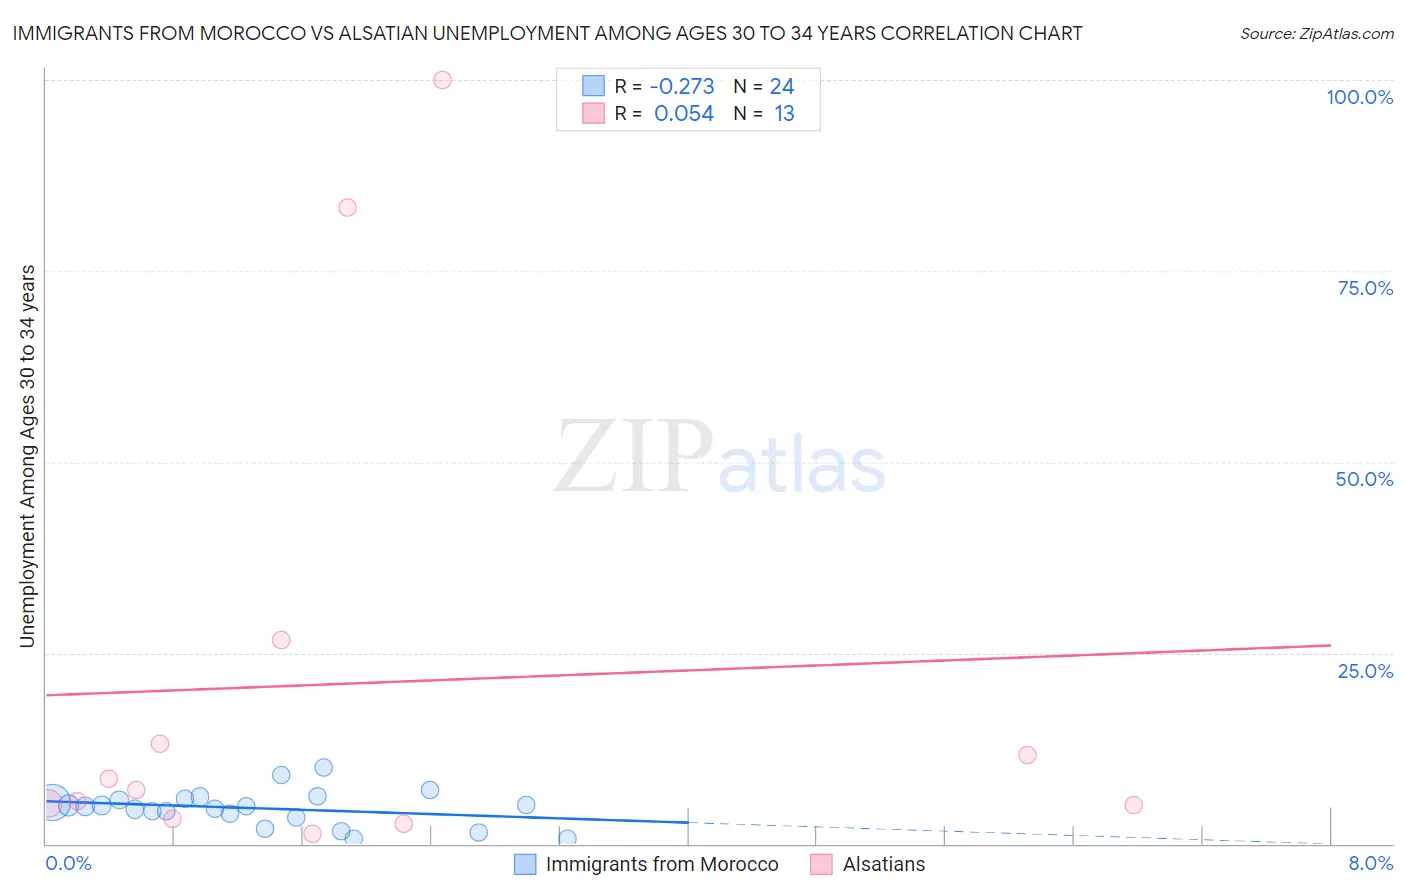
Immigrants from Morocco vs Alsatian Unemployment Among Ages 30 to 34 years Correlation Chart
The statistical analysis conducted on geographies consisting of 175,536,511 people shows a weak negative correlation between the proportion of Immigrants from Morocco and unemployment rate among population between the ages 30 and 34 in the United States with a correlation coefficient (R) of -0.273 and weighted average of 5.1%. Similarly, the statistical analysis conducted on geographies consisting of 80,588,304 people shows a slight positive correlation between the proportion of Alsatians and unemployment rate among population between the ages 30 and 34 in the United States with a correlation coefficient (R) of 0.054 and weighted average of 5.6%, a difference of 10.5%.
Unemployment Among Ages 30 to 34 years Correlation Summary
| Measurement | Immigrants from Morocco | Alsatian |
| Minimum | 0.70% | 1.3% |
| Maximum | 10.0% | 100.0% |
| Range | 9.3% | 98.7% |
| Mean | 4.7% | 21.0% |
| Median | 4.9% | 7.0% |
| Interquartile 25% (IQ1) | 3.7% | 4.2% |
| Interquartile 75% (IQ3) | 5.8% | 19.9% |
| Interquartile Range (IQR) | 2.1% | 15.7% |
| Standard Deviation (Sample) | 2.3% | 32.2% |
| Standard Deviation (Population) | 2.2% | 30.9% |
Similar Demographics by Unemployment Among Ages 30 to 34 years
Demographics Similar to Immigrants from Morocco by Unemployment Among Ages 30 to 34 years
In terms of unemployment among ages 30 to 34 years, the demographic groups most similar to Immigrants from Morocco are Cuban (5.1%, a difference of 0.18%), Chinese (5.1%, a difference of 0.20%), Immigrants from Burma/Myanmar (5.1%, a difference of 0.23%), Turkish (5.1%, a difference of 0.26%), and Puget Sound Salish (5.1%, a difference of 0.30%).
| Demographics | Rating | Rank | Unemployment Among Ages 30 to 34 years |
| Cypriots | 98.4 /100 | #47 | Exceptional 5.1% |
| Assyrians/Chaldeans/Syriacs | 98.4 /100 | #48 | Exceptional 5.1% |
| Immigrants | Malaysia | 98.3 /100 | #49 | Exceptional 5.1% |
| Puget Sound Salish | 98.2 /100 | #50 | Exceptional 5.1% |
| Turks | 98.2 /100 | #51 | Exceptional 5.1% |
| Immigrants | Burma/Myanmar | 98.1 /100 | #52 | Exceptional 5.1% |
| Cubans | 98.1 /100 | #53 | Exceptional 5.1% |
| Immigrants | Morocco | 97.9 /100 | #54 | Exceptional 5.1% |
| Chinese | 97.7 /100 | #55 | Exceptional 5.1% |
| Immigrants | Serbia | 97.4 /100 | #56 | Exceptional 5.1% |
| Immigrants | China | 97.2 /100 | #57 | Exceptional 5.1% |
| Asians | 97.2 /100 | #58 | Exceptional 5.1% |
| Swedes | 97.1 /100 | #59 | Exceptional 5.1% |
| Immigrants | Somalia | 97.1 /100 | #60 | Exceptional 5.1% |
| Indians (Asian) | 97.0 /100 | #61 | Exceptional 5.1% |
Demographics Similar to Alsatians by Unemployment Among Ages 30 to 34 years
In terms of unemployment among ages 30 to 34 years, the demographic groups most similar to Alsatians are Immigrants from Costa Rica (5.6%, a difference of 0.010%), Israeli (5.6%, a difference of 0.22%), Immigrants from Philippines (5.7%, a difference of 0.43%), Immigrants from Cameroon (5.6%, a difference of 0.50%), and French (5.7%, a difference of 0.55%).
| Demographics | Rating | Rank | Unemployment Among Ages 30 to 34 years |
| Nicaraguans | 26.6 /100 | #199 | Fair 5.6% |
| Immigrants | Southern Europe | 25.8 /100 | #200 | Fair 5.6% |
| South American Indians | 24.4 /100 | #201 | Fair 5.6% |
| Immigrants | Germany | 22.9 /100 | #202 | Fair 5.6% |
| Koreans | 20.7 /100 | #203 | Fair 5.6% |
| Immigrants | Cameroon | 18.4 /100 | #204 | Poor 5.6% |
| Immigrants | Costa Rica | 14.4 /100 | #205 | Poor 5.6% |
| Alsatians | 14.3 /100 | #206 | Poor 5.6% |
| Israelis | 12.8 /100 | #207 | Poor 5.6% |
| Immigrants | Philippines | 11.5 /100 | #208 | Poor 5.7% |
| French | 10.8 /100 | #209 | Poor 5.7% |
| Whites/Caucasians | 9.2 /100 | #210 | Tragic 5.7% |
| Spanish American Indians | 8.7 /100 | #211 | Tragic 5.7% |
| Scotch-Irish | 8.6 /100 | #212 | Tragic 5.7% |
| Immigrants | Immigrants | 7.1 /100 | #213 | Tragic 5.7% |