Immigrants from Middle Africa vs Immigrants from Armenia Family Households
COMPARE
Immigrants from Middle Africa
Immigrants from Armenia
Family Households
Family Households Comparison
Immigrants from Middle Africa
Immigrants from Armenia
61.9%
FAMILY HOUSEHOLDS
0.0/ 100
METRIC RATING
316th/ 347
METRIC RANK
63.5%
FAMILY HOUSEHOLDS
2.6/ 100
METRIC RATING
233rd/ 347
METRIC RANK
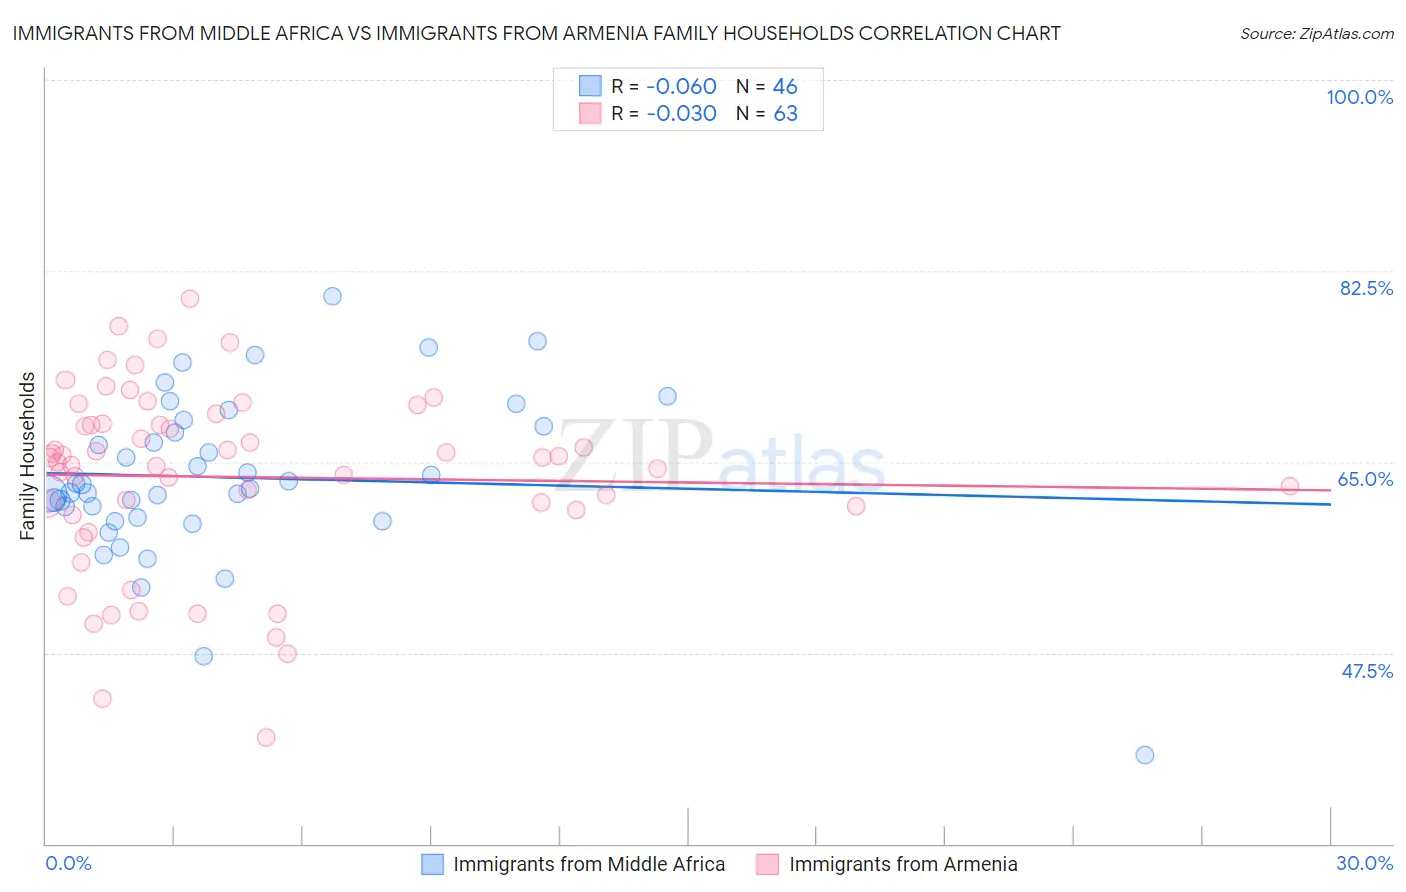
Immigrants from Middle Africa vs Immigrants from Armenia Family Households Correlation Chart
The statistical analysis conducted on geographies consisting of 202,657,833 people shows a slight negative correlation between the proportion of Immigrants from Middle Africa and percentage of family households in the United States with a correlation coefficient (R) of -0.060 and weighted average of 61.9%. Similarly, the statistical analysis conducted on geographies consisting of 97,683,198 people shows no correlation between the proportion of Immigrants from Armenia and percentage of family households in the United States with a correlation coefficient (R) of -0.030 and weighted average of 63.5%, a difference of 2.6%.
Family Households Correlation Summary
| Measurement | Immigrants from Middle Africa | Immigrants from Armenia |
| Minimum | 38.1% | 39.7% |
| Maximum | 80.2% | 79.9% |
| Range | 42.1% | 40.2% |
| Mean | 63.6% | 63.6% |
| Median | 62.7% | 65.3% |
| Interquartile 25% (IQ1) | 60.0% | 60.6% |
| Interquartile 75% (IQ3) | 68.3% | 68.5% |
| Interquartile Range (IQR) | 8.4% | 7.9% |
| Standard Deviation (Sample) | 7.5% | 8.3% |
| Standard Deviation (Population) | 7.5% | 8.3% |
Similar Demographics by Family Households
Demographics Similar to Immigrants from Middle Africa by Family Households
In terms of family households, the demographic groups most similar to Immigrants from Middle Africa are Moroccan (61.9%, a difference of 0.040%), Immigrants from Bosnia and Herzegovina (61.9%, a difference of 0.040%), Immigrants from Cabo Verde (61.9%, a difference of 0.080%), Alaskan Athabascan (61.8%, a difference of 0.12%), and Liberian (62.0%, a difference of 0.13%).
| Demographics | Rating | Rank | Family Households |
| Sub-Saharan Africans | 0.0 /100 | #309 | Tragic 62.1% |
| Immigrants | Liberia | 0.0 /100 | #310 | Tragic 62.0% |
| Immigrants | Morocco | 0.0 /100 | #311 | Tragic 62.0% |
| Immigrants | Latvia | 0.0 /100 | #312 | Tragic 62.0% |
| Liberians | 0.0 /100 | #313 | Tragic 62.0% |
| Immigrants | Cabo Verde | 0.0 /100 | #314 | Tragic 61.9% |
| Moroccans | 0.0 /100 | #315 | Tragic 61.9% |
| Immigrants | Middle Africa | 0.0 /100 | #316 | Tragic 61.9% |
| Immigrants | Bosnia and Herzegovina | 0.0 /100 | #317 | Tragic 61.9% |
| Alaskan Athabascans | 0.0 /100 | #318 | Tragic 61.8% |
| Cape Verdeans | 0.0 /100 | #319 | Tragic 61.8% |
| Ugandans | 0.0 /100 | #320 | Tragic 61.7% |
| Alsatians | 0.0 /100 | #321 | Tragic 61.7% |
| Immigrants | Serbia | 0.0 /100 | #322 | Tragic 61.6% |
| Tlingit-Haida | 0.0 /100 | #323 | Tragic 61.6% |
Demographics Similar to Immigrants from Armenia by Family Households
In terms of family households, the demographic groups most similar to Immigrants from Armenia are Immigrants from Northern Africa (63.5%, a difference of 0.010%), Finnish (63.5%, a difference of 0.030%), Immigrants from Greece (63.5%, a difference of 0.050%), Albanian (63.5%, a difference of 0.050%), and Immigrants from Brazil (63.6%, a difference of 0.060%).
| Demographics | Rating | Rank | Family Households |
| Immigrants | Bahamas | 4.2 /100 | #226 | Tragic 63.6% |
| Trinidadians and Tobagonians | 4.1 /100 | #227 | Tragic 63.6% |
| Blackfeet | 3.6 /100 | #228 | Tragic 63.6% |
| Bulgarians | 3.4 /100 | #229 | Tragic 63.6% |
| Immigrants | Brazil | 3.0 /100 | #230 | Tragic 63.6% |
| Immigrants | Greece | 2.9 /100 | #231 | Tragic 63.5% |
| Immigrants | Northern Africa | 2.6 /100 | #232 | Tragic 63.5% |
| Immigrants | Armenia | 2.6 /100 | #233 | Tragic 63.5% |
| Finns | 2.3 /100 | #234 | Tragic 63.5% |
| Albanians | 2.2 /100 | #235 | Tragic 63.5% |
| Ghanaians | 2.1 /100 | #236 | Tragic 63.5% |
| Comanche | 2.1 /100 | #237 | Tragic 63.5% |
| Immigrants | Zimbabwe | 2.0 /100 | #238 | Tragic 63.5% |
| Aleuts | 1.9 /100 | #239 | Tragic 63.4% |
| South Africans | 1.9 /100 | #240 | Tragic 63.4% |