Immigrants from Micronesia vs Nonimmigrants Births to Unmarried Women
COMPARE
Immigrants from Micronesia
Nonimmigrants
Births to Unmarried Women
Births to Unmarried Women Comparison
Immigrants from Micronesia
Nonimmigrants
32.9%
BIRTHS TO UNMARRIED WOMEN
16.6/ 100
METRIC RATING
202nd/ 347
METRIC RANK
35.5%
BIRTHS TO UNMARRIED WOMEN
0.6/ 100
METRIC RATING
248th/ 347
METRIC RANK
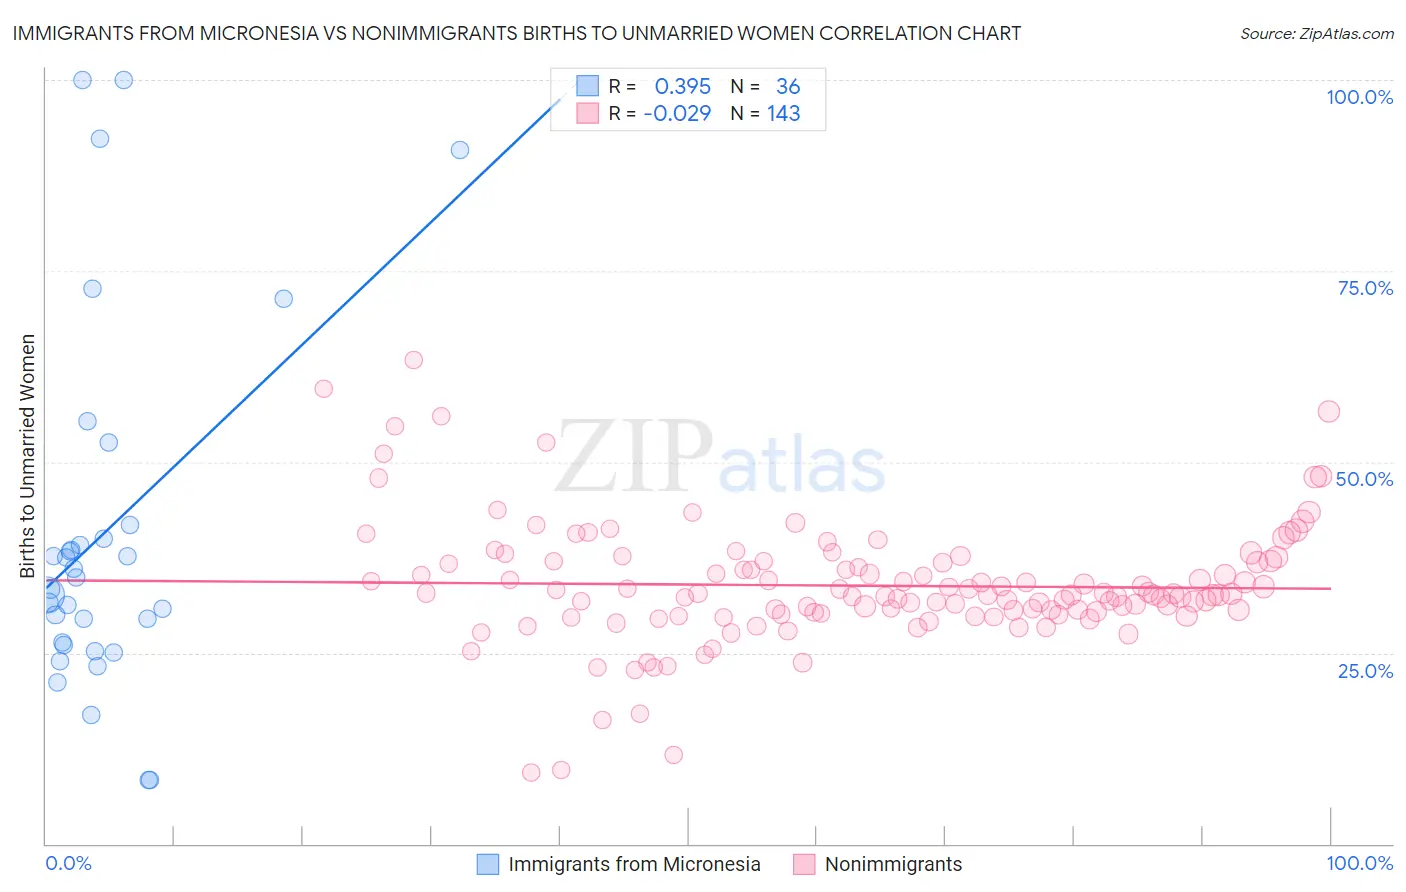
Immigrants from Micronesia vs Nonimmigrants Births to Unmarried Women Correlation Chart
The statistical analysis conducted on geographies consisting of 60,950,246 people shows a mild positive correlation between the proportion of Immigrants from Micronesia and percentage of births to unmarried women in the United States with a correlation coefficient (R) of 0.395 and weighted average of 32.9%. Similarly, the statistical analysis conducted on geographies consisting of 513,664,805 people shows no correlation between the proportion of Nonimmigrants and percentage of births to unmarried women in the United States with a correlation coefficient (R) of -0.029 and weighted average of 35.5%, a difference of 8.1%.
Births to Unmarried Women Correlation Summary
| Measurement | Immigrants from Micronesia | Nonimmigrants |
| Minimum | 8.4% | 9.4% |
| Maximum | 100.0% | 63.3% |
| Range | 91.6% | 53.9% |
| Mean | 40.8% | 33.8% |
| Median | 34.1% | 32.6% |
| Interquartile 25% (IQ1) | 26.2% | 30.2% |
| Interquartile 75% (IQ3) | 40.9% | 37.0% |
| Interquartile Range (IQR) | 14.7% | 6.8% |
| Standard Deviation (Sample) | 23.9% | 8.1% |
| Standard Deviation (Population) | 23.5% | 8.0% |
Similar Demographics by Births to Unmarried Women
Demographics Similar to Immigrants from Micronesia by Births to Unmarried Women
In terms of births to unmarried women, the demographic groups most similar to Immigrants from Micronesia are Immigrants from Burma/Myanmar (32.9%, a difference of 0.010%), Immigrants from Germany (32.8%, a difference of 0.34%), Immigrants from Thailand (32.8%, a difference of 0.35%), Ute (33.0%, a difference of 0.38%), and Immigrants from Africa (33.0%, a difference of 0.40%).
| Demographics | Rating | Rank | Births to Unmarried Women |
| Samoans | 21.9 /100 | #195 | Fair 32.6% |
| Immigrants | Colombia | 21.7 /100 | #196 | Fair 32.6% |
| Immigrants | Immigrants | 20.6 /100 | #197 | Fair 32.7% |
| Costa Ricans | 20.3 /100 | #198 | Fair 32.7% |
| Immigrants | Thailand | 18.9 /100 | #199 | Poor 32.8% |
| Immigrants | Germany | 18.8 /100 | #200 | Poor 32.8% |
| Immigrants | Burma/Myanmar | 16.7 /100 | #201 | Poor 32.9% |
| Immigrants | Micronesia | 16.6 /100 | #202 | Poor 32.9% |
| Ute | 14.4 /100 | #203 | Poor 33.0% |
| Immigrants | Africa | 14.3 /100 | #204 | Poor 33.0% |
| German Russians | 13.1 /100 | #205 | Poor 33.1% |
| Uruguayans | 12.8 /100 | #206 | Poor 33.1% |
| Immigrants | Sudan | 11.5 /100 | #207 | Poor 33.2% |
| Hawaiians | 11.3 /100 | #208 | Poor 33.2% |
| Whites/Caucasians | 10.7 /100 | #209 | Poor 33.3% |
Demographics Similar to Nonimmigrants by Births to Unmarried Women
In terms of births to unmarried women, the demographic groups most similar to Nonimmigrants are Bermudan (35.5%, a difference of 0.010%), Immigrants from Nigeria (35.4%, a difference of 0.33%), Nigerian (35.3%, a difference of 0.54%), Mexican American Indian (35.7%, a difference of 0.62%), and Shoshone (35.3%, a difference of 0.65%).
| Demographics | Rating | Rank | Births to Unmarried Women |
| Immigrants | Guyana | 1.2 /100 | #241 | Tragic 35.0% |
| Indonesians | 1.2 /100 | #242 | Tragic 35.0% |
| Japanese | 0.9 /100 | #243 | Tragic 35.2% |
| Guyanese | 0.9 /100 | #244 | Tragic 35.2% |
| Shoshone | 0.8 /100 | #245 | Tragic 35.3% |
| Nigerians | 0.7 /100 | #246 | Tragic 35.3% |
| Immigrants | Nigeria | 0.7 /100 | #247 | Tragic 35.4% |
| Immigrants | Nonimmigrants | 0.6 /100 | #248 | Tragic 35.5% |
| Bermudans | 0.6 /100 | #249 | Tragic 35.5% |
| Mexican American Indians | 0.4 /100 | #250 | Tragic 35.7% |
| Immigrants | Western Africa | 0.3 /100 | #251 | Tragic 36.0% |
| Salvadorans | 0.3 /100 | #252 | Tragic 36.0% |
| Immigrants | Portugal | 0.2 /100 | #253 | Tragic 36.2% |
| Potawatomi | 0.2 /100 | #254 | Tragic 36.2% |
| Chickasaw | 0.2 /100 | #255 | Tragic 36.3% |