Immigrants from Micronesia vs Immigrants from Switzerland Births to Unmarried Women
COMPARE
Immigrants from Micronesia
Immigrants from Switzerland
Births to Unmarried Women
Births to Unmarried Women Comparison
Immigrants from Micronesia
Immigrants from Switzerland
32.9%
BIRTHS TO UNMARRIED WOMEN
16.6/ 100
METRIC RATING
202nd/ 347
METRIC RANK
28.6%
BIRTHS TO UNMARRIED WOMEN
98.4/ 100
METRIC RATING
75th/ 347
METRIC RANK
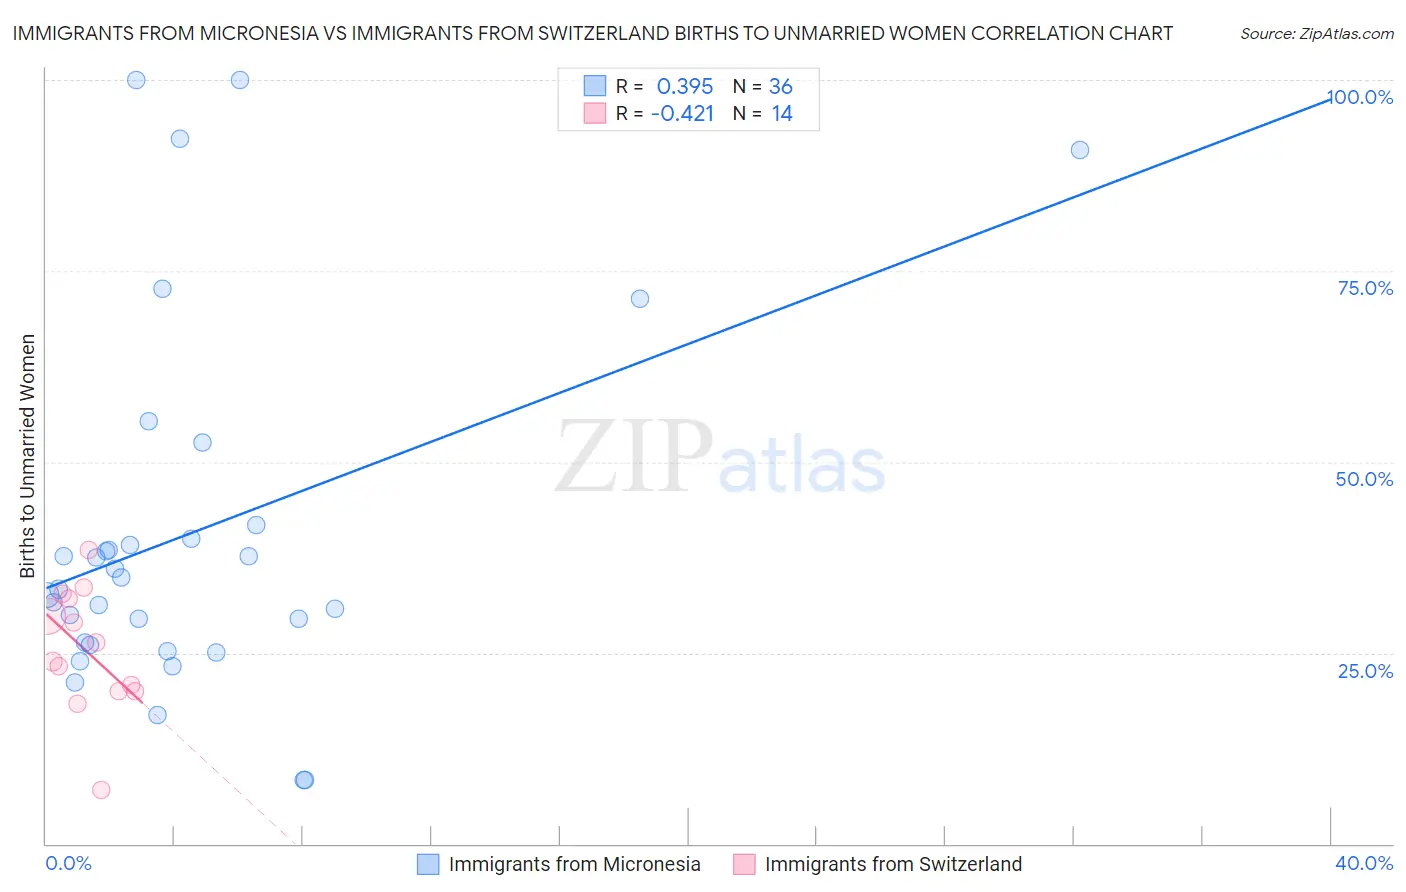
Immigrants from Micronesia vs Immigrants from Switzerland Births to Unmarried Women Correlation Chart
The statistical analysis conducted on geographies consisting of 60,950,246 people shows a mild positive correlation between the proportion of Immigrants from Micronesia and percentage of births to unmarried women in the United States with a correlation coefficient (R) of 0.395 and weighted average of 32.9%. Similarly, the statistical analysis conducted on geographies consisting of 140,222,644 people shows a moderate negative correlation between the proportion of Immigrants from Switzerland and percentage of births to unmarried women in the United States with a correlation coefficient (R) of -0.421 and weighted average of 28.6%, a difference of 15.0%.
Births to Unmarried Women Correlation Summary
| Measurement | Immigrants from Micronesia | Immigrants from Switzerland |
| Minimum | 8.4% | 7.1% |
| Maximum | 100.0% | 38.5% |
| Range | 91.6% | 31.4% |
| Mean | 40.8% | 25.4% |
| Median | 34.1% | 25.1% |
| Interquartile 25% (IQ1) | 26.2% | 20.0% |
| Interquartile 75% (IQ3) | 40.9% | 32.0% |
| Interquartile Range (IQR) | 14.7% | 12.0% |
| Standard Deviation (Sample) | 23.9% | 8.0% |
| Standard Deviation (Population) | 23.5% | 7.8% |
Similar Demographics by Births to Unmarried Women
Demographics Similar to Immigrants from Micronesia by Births to Unmarried Women
In terms of births to unmarried women, the demographic groups most similar to Immigrants from Micronesia are Immigrants from Burma/Myanmar (32.9%, a difference of 0.010%), Immigrants from Germany (32.8%, a difference of 0.34%), Immigrants from Thailand (32.8%, a difference of 0.35%), Ute (33.0%, a difference of 0.38%), and Immigrants from Africa (33.0%, a difference of 0.40%).
| Demographics | Rating | Rank | Births to Unmarried Women |
| Samoans | 21.9 /100 | #195 | Fair 32.6% |
| Immigrants | Colombia | 21.7 /100 | #196 | Fair 32.6% |
| Immigrants | Immigrants | 20.6 /100 | #197 | Fair 32.7% |
| Costa Ricans | 20.3 /100 | #198 | Fair 32.7% |
| Immigrants | Thailand | 18.9 /100 | #199 | Poor 32.8% |
| Immigrants | Germany | 18.8 /100 | #200 | Poor 32.8% |
| Immigrants | Burma/Myanmar | 16.7 /100 | #201 | Poor 32.9% |
| Immigrants | Micronesia | 16.6 /100 | #202 | Poor 32.9% |
| Ute | 14.4 /100 | #203 | Poor 33.0% |
| Immigrants | Africa | 14.3 /100 | #204 | Poor 33.0% |
| German Russians | 13.1 /100 | #205 | Poor 33.1% |
| Uruguayans | 12.8 /100 | #206 | Poor 33.1% |
| Immigrants | Sudan | 11.5 /100 | #207 | Poor 33.2% |
| Hawaiians | 11.3 /100 | #208 | Poor 33.2% |
| Whites/Caucasians | 10.7 /100 | #209 | Poor 33.3% |
Demographics Similar to Immigrants from Switzerland by Births to Unmarried Women
In terms of births to unmarried women, the demographic groups most similar to Immigrants from Switzerland are Israeli (28.6%, a difference of 0.020%), Immigrants from Bolivia (28.6%, a difference of 0.090%), Albanian (28.5%, a difference of 0.11%), Immigrants from Sweden (28.5%, a difference of 0.16%), and Immigrants from Northern Europe (28.6%, a difference of 0.21%).
| Demographics | Rating | Rank | Births to Unmarried Women |
| Immigrants | Europe | 98.7 /100 | #68 | Exceptional 28.4% |
| Bolivians | 98.7 /100 | #69 | Exceptional 28.5% |
| Laotians | 98.6 /100 | #70 | Exceptional 28.5% |
| Jordanians | 98.5 /100 | #71 | Exceptional 28.5% |
| Immigrants | Sweden | 98.5 /100 | #72 | Exceptional 28.5% |
| Albanians | 98.5 /100 | #73 | Exceptional 28.5% |
| Immigrants | Bolivia | 98.5 /100 | #74 | Exceptional 28.6% |
| Immigrants | Switzerland | 98.4 /100 | #75 | Exceptional 28.6% |
| Israelis | 98.4 /100 | #76 | Exceptional 28.6% |
| Immigrants | Northern Europe | 98.3 /100 | #77 | Exceptional 28.6% |
| Zimbabweans | 98.2 /100 | #78 | Exceptional 28.7% |
| Danes | 98.2 /100 | #79 | Exceptional 28.7% |
| Immigrants | Afghanistan | 98.1 /100 | #80 | Exceptional 28.7% |
| Immigrants | Austria | 98.1 /100 | #81 | Exceptional 28.7% |
| Romanians | 98.0 /100 | #82 | Exceptional 28.7% |