Immigrants from Lithuania vs Okinawan Householder Income Ages 25 - 44 years
COMPARE
Immigrants from Lithuania
Okinawan
Householder Income Ages 25 - 44 years
Householder Income Ages 25 - 44 years Comparison
Immigrants from Lithuania
Okinawans
$108,149
HOUSEHOLDER INCOME AGES 25 - 44 YEARS
99.9/ 100
METRIC RATING
40th/ 347
METRIC RANK
$119,349
HOUSEHOLDER INCOME AGES 25 - 44 YEARS
100.0/ 100
METRIC RATING
11th/ 347
METRIC RANK
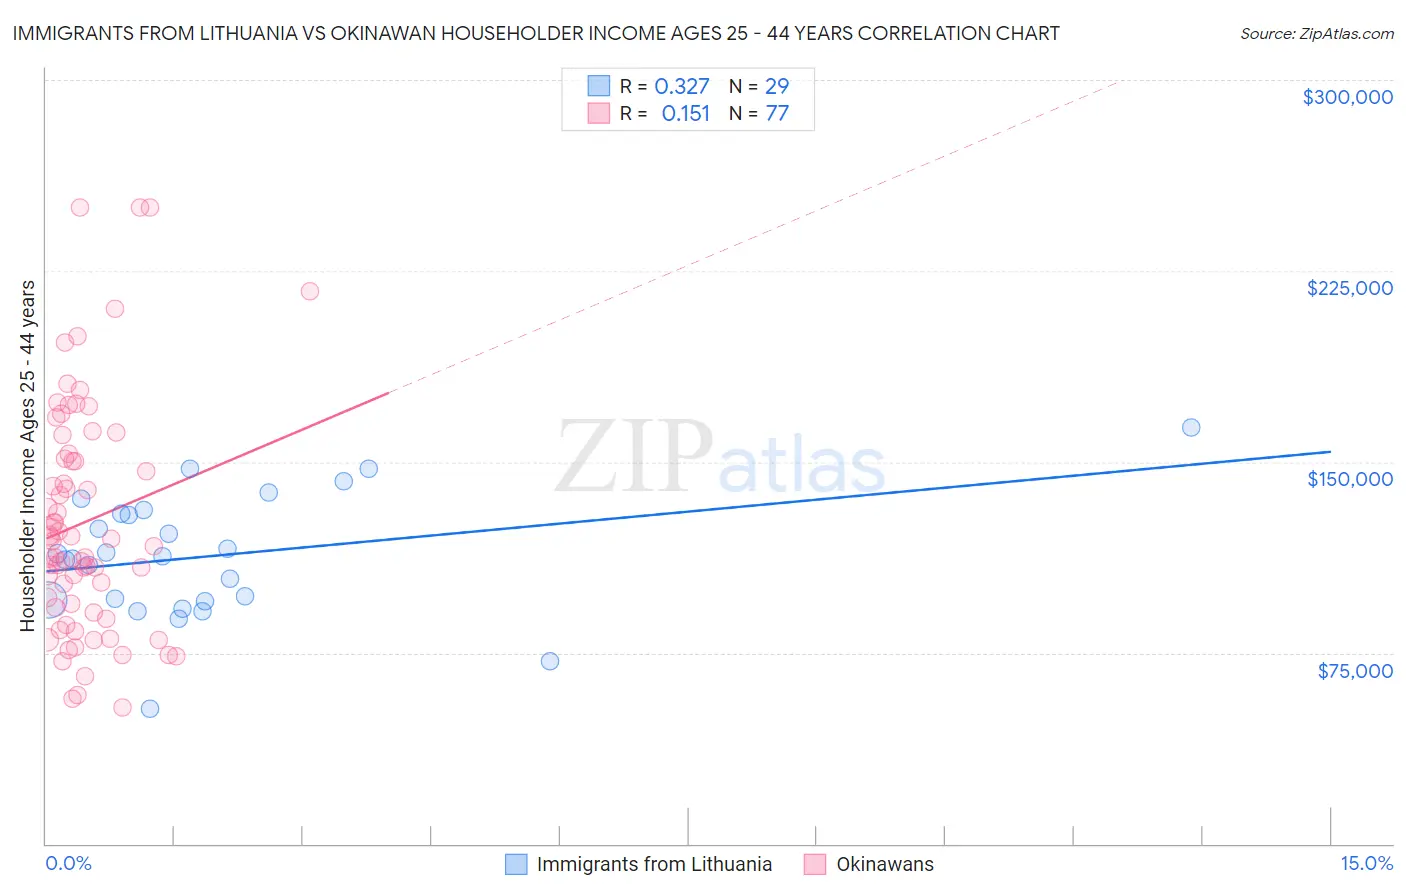
Immigrants from Lithuania vs Okinawan Householder Income Ages 25 - 44 years Correlation Chart
The statistical analysis conducted on geographies consisting of 117,642,773 people shows a mild positive correlation between the proportion of Immigrants from Lithuania and household income with householder between the ages 25 and 44 in the United States with a correlation coefficient (R) of 0.327 and weighted average of $108,149. Similarly, the statistical analysis conducted on geographies consisting of 73,689,702 people shows a poor positive correlation between the proportion of Okinawans and household income with householder between the ages 25 and 44 in the United States with a correlation coefficient (R) of 0.151 and weighted average of $119,349, a difference of 10.4%.
Householder Income Ages 25 - 44 years Correlation Summary
| Measurement | Immigrants from Lithuania | Okinawan |
| Minimum | $52,861 | $53,516 |
| Maximum | $163,542 | $250,001 |
| Range | $110,681 | $196,485 |
| Mean | $112,993 | $126,213 |
| Median | $112,685 | $118,882 |
| Interquartile 25% (IQ1) | $95,623 | $91,836 |
| Interquartile 75% (IQ3) | $130,271 | $152,291 |
| Interquartile Range (IQR) | $34,649 | $60,455 |
| Standard Deviation (Sample) | $24,241 | $45,314 |
| Standard Deviation (Population) | $23,819 | $45,019 |
Similar Demographics by Householder Income Ages 25 - 44 years
Demographics Similar to Immigrants from Lithuania by Householder Income Ages 25 - 44 years
In terms of householder income ages 25 - 44 years, the demographic groups most similar to Immigrants from Lithuania are Immigrants from Bolivia ($108,128, a difference of 0.020%), Immigrants from France ($108,257, a difference of 0.10%), Australian ($107,912, a difference of 0.22%), Soviet Union ($108,457, a difference of 0.29%), and Immigrants from Malaysia ($107,650, a difference of 0.46%).
| Demographics | Rating | Rank | Householder Income Ages 25 - 44 years |
| Bhutanese | 100.0 /100 | #33 | Exceptional $109,520 |
| Bolivians | 100.0 /100 | #34 | Exceptional $109,372 |
| Immigrants | Switzerland | 100.0 /100 | #35 | Exceptional $109,185 |
| Latvians | 100.0 /100 | #36 | Exceptional $108,926 |
| Immigrants | Russia | 100.0 /100 | #37 | Exceptional $108,751 |
| Soviet Union | 100.0 /100 | #38 | Exceptional $108,457 |
| Immigrants | France | 99.9 /100 | #39 | Exceptional $108,257 |
| Immigrants | Lithuania | 99.9 /100 | #40 | Exceptional $108,149 |
| Immigrants | Bolivia | 99.9 /100 | #41 | Exceptional $108,128 |
| Australians | 99.9 /100 | #42 | Exceptional $107,912 |
| Immigrants | Malaysia | 99.9 /100 | #43 | Exceptional $107,650 |
| Immigrants | Indonesia | 99.9 /100 | #44 | Exceptional $107,627 |
| Israelis | 99.9 /100 | #45 | Exceptional $107,579 |
| Immigrants | Belarus | 99.9 /100 | #46 | Exceptional $107,393 |
| Estonians | 99.9 /100 | #47 | Exceptional $107,269 |
Demographics Similar to Okinawans by Householder Income Ages 25 - 44 years
In terms of householder income ages 25 - 44 years, the demographic groups most similar to Okinawans are Indian (Asian) ($119,496, a difference of 0.12%), Immigrants from Iran ($119,204, a difference of 0.12%), Immigrants from China ($119,756, a difference of 0.34%), Iranian ($120,292, a difference of 0.79%), and Immigrants from Ireland ($120,333, a difference of 0.82%).
| Demographics | Rating | Rank | Householder Income Ages 25 - 44 years |
| Immigrants | Singapore | 100.0 /100 | #4 | Exceptional $124,429 |
| Immigrants | India | 100.0 /100 | #5 | Exceptional $124,238 |
| Thais | 100.0 /100 | #6 | Exceptional $121,778 |
| Immigrants | Ireland | 100.0 /100 | #7 | Exceptional $120,333 |
| Iranians | 100.0 /100 | #8 | Exceptional $120,292 |
| Immigrants | China | 100.0 /100 | #9 | Exceptional $119,756 |
| Indians (Asian) | 100.0 /100 | #10 | Exceptional $119,496 |
| Okinawans | 100.0 /100 | #11 | Exceptional $119,349 |
| Immigrants | Iran | 100.0 /100 | #12 | Exceptional $119,204 |
| Immigrants | Eastern Asia | 100.0 /100 | #13 | Exceptional $118,056 |
| Immigrants | Israel | 100.0 /100 | #14 | Exceptional $117,219 |
| Immigrants | South Central Asia | 100.0 /100 | #15 | Exceptional $116,626 |
| Cypriots | 100.0 /100 | #16 | Exceptional $116,364 |
| Immigrants | Australia | 100.0 /100 | #17 | Exceptional $115,947 |
| Eastern Europeans | 100.0 /100 | #18 | Exceptional $114,523 |