Immigrants from Lebanon vs Crow Unemployment Among Ages 35 to 44 years
COMPARE
Immigrants from Lebanon
Crow
Unemployment Among Ages 35 to 44 years
Unemployment Among Ages 35 to 44 years Comparison
Immigrants from Lebanon
Crow
5.0%
UNEMPLOYMENT AMONG AGES 35 TO 44 YEARS
2.7/ 100
METRIC RATING
225th/ 347
METRIC RANK
15.7%
UNEMPLOYMENT AMONG AGES 35 TO 44 YEARS
0.0/ 100
METRIC RATING
346th/ 347
METRIC RANK
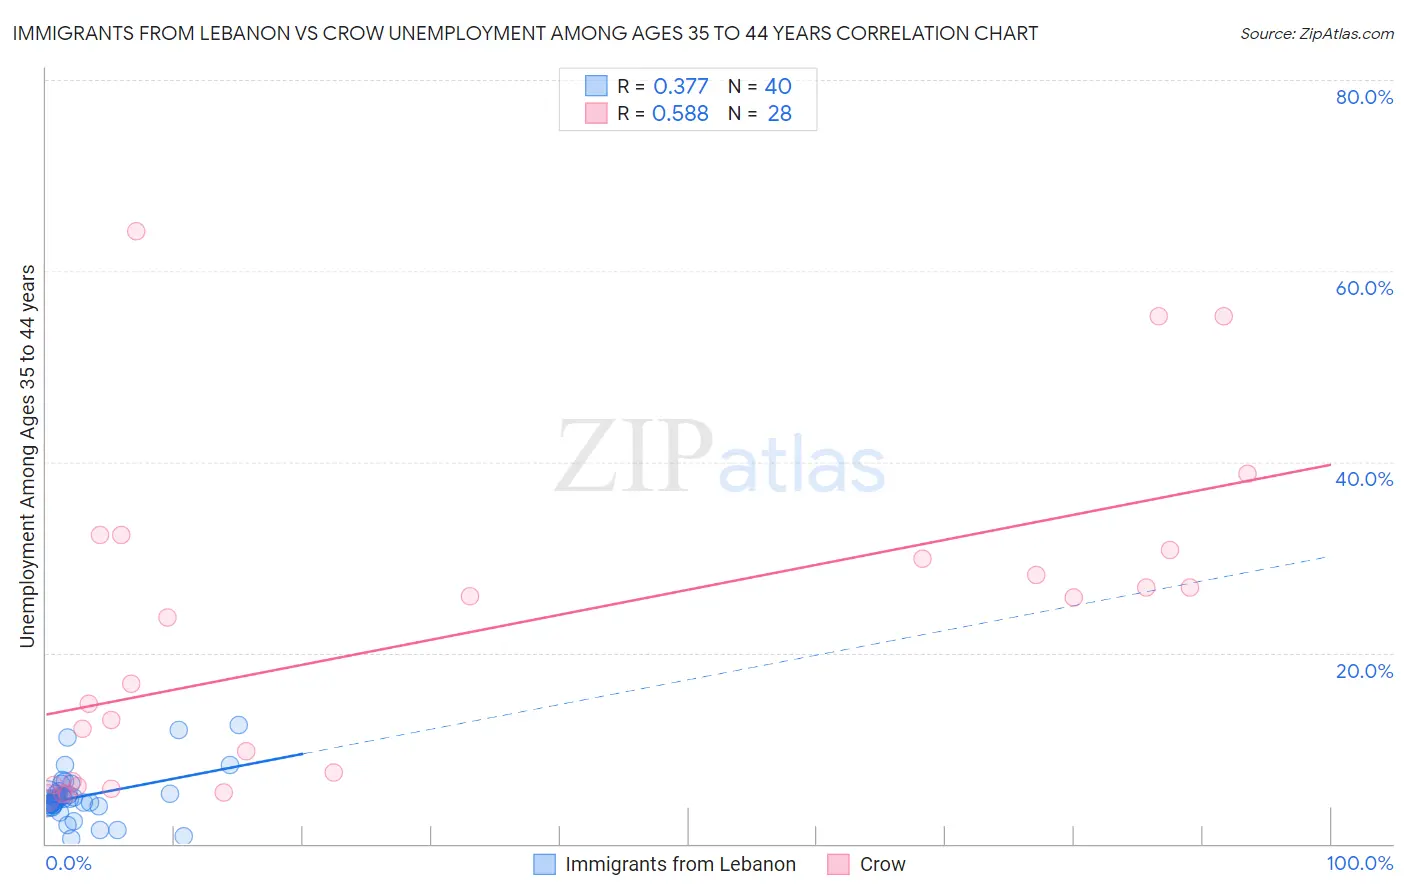
Immigrants from Lebanon vs Crow Unemployment Among Ages 35 to 44 years Correlation Chart
The statistical analysis conducted on geographies consisting of 215,332,432 people shows a mild positive correlation between the proportion of Immigrants from Lebanon and unemployment rate among population between the ages 35 and 44 in the United States with a correlation coefficient (R) of 0.377 and weighted average of 5.0%. Similarly, the statistical analysis conducted on geographies consisting of 58,626,239 people shows a substantial positive correlation between the proportion of Crow and unemployment rate among population between the ages 35 and 44 in the United States with a correlation coefficient (R) of 0.588 and weighted average of 15.7%, a difference of 215.0%.
Unemployment Among Ages 35 to 44 years Correlation Summary
| Measurement | Immigrants from Lebanon | Crow |
| Minimum | 0.50% | 4.9% |
| Maximum | 12.5% | 64.2% |
| Range | 12.0% | 59.3% |
| Mean | 5.0% | 22.0% |
| Median | 4.6% | 20.2% |
| Interquartile 25% (IQ1) | 4.1% | 6.4% |
| Interquartile 75% (IQ3) | 5.4% | 30.3% |
| Interquartile Range (IQR) | 1.3% | 23.9% |
| Standard Deviation (Sample) | 2.6% | 16.7% |
| Standard Deviation (Population) | 2.6% | 16.4% |
Similar Demographics by Unemployment Among Ages 35 to 44 years
Demographics Similar to Immigrants from Lebanon by Unemployment Among Ages 35 to 44 years
In terms of unemployment among ages 35 to 44 years, the demographic groups most similar to Immigrants from Lebanon are Panamanian (5.0%, a difference of 0.12%), Potawatomi (5.0%, a difference of 0.12%), Immigrants from Panama (5.0%, a difference of 0.35%), Hmong (5.0%, a difference of 0.43%), and Immigrants from Uzbekistan (5.0%, a difference of 0.59%).
| Demographics | Rating | Rank | Unemployment Among Ages 35 to 44 years |
| Chickasaw | 5.7 /100 | #218 | Tragic 4.9% |
| Sierra Leoneans | 4.8 /100 | #219 | Tragic 4.9% |
| Immigrants | Sierra Leone | 4.7 /100 | #220 | Tragic 4.9% |
| Bermudans | 3.9 /100 | #221 | Tragic 5.0% |
| Hmong | 3.5 /100 | #222 | Tragic 5.0% |
| Immigrants | Panama | 3.3 /100 | #223 | Tragic 5.0% |
| Panamanians | 2.9 /100 | #224 | Tragic 5.0% |
| Immigrants | Lebanon | 2.7 /100 | #225 | Tragic 5.0% |
| Potawatomi | 2.5 /100 | #226 | Tragic 5.0% |
| Immigrants | Uzbekistan | 1.9 /100 | #227 | Tragic 5.0% |
| Samoans | 1.8 /100 | #228 | Tragic 5.0% |
| Immigrants | Cambodia | 1.5 /100 | #229 | Tragic 5.0% |
| Liberians | 1.3 /100 | #230 | Tragic 5.1% |
| Japanese | 1.2 /100 | #231 | Tragic 5.1% |
| Iroquois | 1.2 /100 | #232 | Tragic 5.1% |
Demographics Similar to Crow by Unemployment Among Ages 35 to 44 years
In terms of unemployment among ages 35 to 44 years, the demographic groups most similar to Crow are Yuman (16.9%, a difference of 7.7%), Yup'ik (14.4%, a difference of 8.8%), Pima (11.8%, a difference of 33.6%), Arapaho (10.3%, a difference of 52.7%), and Navajo (9.3%, a difference of 68.2%).
| Demographics | Rating | Rank | Unemployment Among Ages 35 to 44 years |
| Puerto Ricans | 0.0 /100 | #333 | Tragic 7.6% |
| Houma | 0.0 /100 | #334 | Tragic 7.8% |
| Sioux | 0.0 /100 | #335 | Tragic 8.4% |
| Apache | 0.0 /100 | #336 | Tragic 8.4% |
| Tohono O'odham | 0.0 /100 | #337 | Tragic 8.4% |
| Cheyenne | 0.0 /100 | #338 | Tragic 8.5% |
| Inupiat | 0.0 /100 | #339 | Tragic 8.6% |
| Alaskan Athabascans | 0.0 /100 | #340 | Tragic 8.6% |
| Hopi | 0.0 /100 | #341 | Tragic 8.9% |
| Navajo | 0.0 /100 | #342 | Tragic 9.3% |
| Arapaho | 0.0 /100 | #343 | Tragic 10.3% |
| Pima | 0.0 /100 | #344 | Tragic 11.8% |
| Yup'ik | 0.0 /100 | #345 | Tragic 14.4% |
| Crow | 0.0 /100 | #346 | Tragic 15.7% |
| Yuman | 0.0 /100 | #347 | Tragic 16.9% |