Immigrants from Lebanon vs Cheyenne Married-couple Households
COMPARE
Immigrants from Lebanon
Cheyenne
Married-couple Households
Married-couple Households Comparison
Immigrants from Lebanon
Cheyenne
48.9%
MARRIED-COUPLE HOUSEHOLDS
99.6/ 100
METRIC RATING
41st/ 347
METRIC RANK
42.3%
MARRIED-COUPLE HOUSEHOLDS
0.0/ 100
METRIC RATING
284th/ 347
METRIC RANK
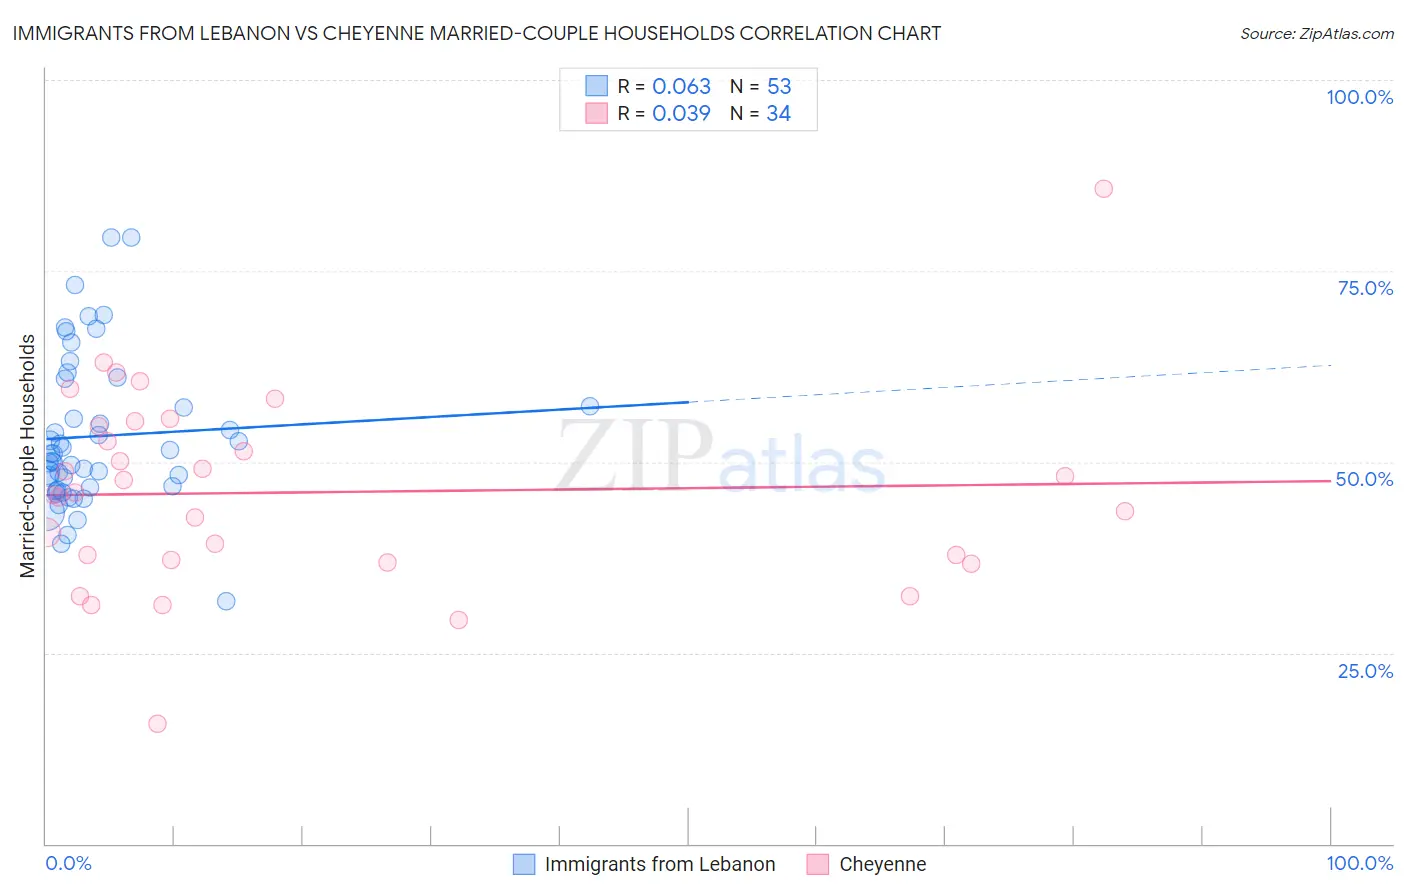
Immigrants from Lebanon vs Cheyenne Married-couple Households Correlation Chart
The statistical analysis conducted on geographies consisting of 217,124,859 people shows a slight positive correlation between the proportion of Immigrants from Lebanon and percentage of married-couple family households in the United States with a correlation coefficient (R) of 0.063 and weighted average of 48.9%. Similarly, the statistical analysis conducted on geographies consisting of 80,704,994 people shows no correlation between the proportion of Cheyenne and percentage of married-couple family households in the United States with a correlation coefficient (R) of 0.039 and weighted average of 42.3%, a difference of 15.6%.
Married-couple Households Correlation Summary
| Measurement | Immigrants from Lebanon | Cheyenne |
| Minimum | 31.7% | 15.8% |
| Maximum | 79.4% | 85.7% |
| Range | 47.7% | 69.9% |
| Mean | 53.4% | 46.0% |
| Median | 51.1% | 45.8% |
| Interquartile 25% (IQ1) | 46.5% | 37.1% |
| Interquartile 75% (IQ3) | 59.0% | 54.6% |
| Interquartile Range (IQR) | 12.6% | 17.5% |
| Standard Deviation (Sample) | 10.0% | 12.9% |
| Standard Deviation (Population) | 9.9% | 12.7% |
Similar Demographics by Married-couple Households
Demographics Similar to Immigrants from Lebanon by Married-couple Households
In terms of married-couple households, the demographic groups most similar to Immigrants from Lebanon are Immigrants from Bolivia (48.9%, a difference of 0.030%), Lithuanian (48.9%, a difference of 0.050%), Immigrants from Vietnam (48.8%, a difference of 0.050%), Immigrants from Iran (48.8%, a difference of 0.10%), and Greek (48.9%, a difference of 0.13%).
| Demographics | Rating | Rank | Married-couple Households |
| Italians | 99.7 /100 | #34 | Exceptional 49.0% |
| Scottish | 99.7 /100 | #35 | Exceptional 49.0% |
| Iranians | 99.7 /100 | #36 | Exceptional 49.0% |
| Sri Lankans | 99.7 /100 | #37 | Exceptional 49.0% |
| Greeks | 99.7 /100 | #38 | Exceptional 48.9% |
| Lithuanians | 99.6 /100 | #39 | Exceptional 48.9% |
| Immigrants | Bolivia | 99.6 /100 | #40 | Exceptional 48.9% |
| Immigrants | Lebanon | 99.6 /100 | #41 | Exceptional 48.9% |
| Immigrants | Vietnam | 99.6 /100 | #42 | Exceptional 48.8% |
| Immigrants | Iran | 99.6 /100 | #43 | Exceptional 48.8% |
| Welsh | 99.5 /100 | #44 | Exceptional 48.8% |
| Immigrants | Eastern Asia | 99.5 /100 | #45 | Exceptional 48.8% |
| Tsimshian | 99.5 /100 | #46 | Exceptional 48.7% |
| British | 99.5 /100 | #47 | Exceptional 48.7% |
| Indians (Asian) | 99.4 /100 | #48 | Exceptional 48.7% |
Demographics Similar to Cheyenne by Married-couple Households
In terms of married-couple households, the demographic groups most similar to Cheyenne are Ghanaian (42.2%, a difference of 0.030%), Belizean (42.2%, a difference of 0.040%), Chippewa (42.1%, a difference of 0.27%), Immigrants from Eritrea (42.1%, a difference of 0.35%), and Inupiat (42.4%, a difference of 0.36%).
| Demographics | Rating | Rank | Married-couple Households |
| Immigrants | Eastern Africa | 0.0 /100 | #277 | Tragic 42.9% |
| Immigrants | Africa | 0.0 /100 | #278 | Tragic 42.9% |
| Sierra Leoneans | 0.0 /100 | #279 | Tragic 42.9% |
| Immigrants | Ecuador | 0.0 /100 | #280 | Tragic 42.9% |
| Immigrants | Guatemala | 0.0 /100 | #281 | Tragic 42.8% |
| Bermudans | 0.0 /100 | #282 | Tragic 42.4% |
| Inupiat | 0.0 /100 | #283 | Tragic 42.4% |
| Cheyenne | 0.0 /100 | #284 | Tragic 42.3% |
| Ghanaians | 0.0 /100 | #285 | Tragic 42.2% |
| Belizeans | 0.0 /100 | #286 | Tragic 42.2% |
| Chippewa | 0.0 /100 | #287 | Tragic 42.1% |
| Immigrants | Eritrea | 0.0 /100 | #288 | Tragic 42.1% |
| Sudanese | 0.0 /100 | #289 | Tragic 42.1% |
| Hondurans | 0.0 /100 | #290 | Tragic 42.1% |
| Paiute | 0.0 /100 | #291 | Tragic 42.1% |