Immigrants from Lebanon vs Immigrants from Bosnia and Herzegovina Married-couple Households
COMPARE
Immigrants from Lebanon
Immigrants from Bosnia and Herzegovina
Married-couple Households
Married-couple Households Comparison
Immigrants from Lebanon
Immigrants from Bosnia and Herzegovina
48.9%
MARRIED-COUPLE HOUSEHOLDS
99.6/ 100
METRIC RATING
41st/ 347
METRIC RANK
44.4%
MARRIED-COUPLE HOUSEHOLDS
1.0/ 100
METRIC RATING
241st/ 347
METRIC RANK
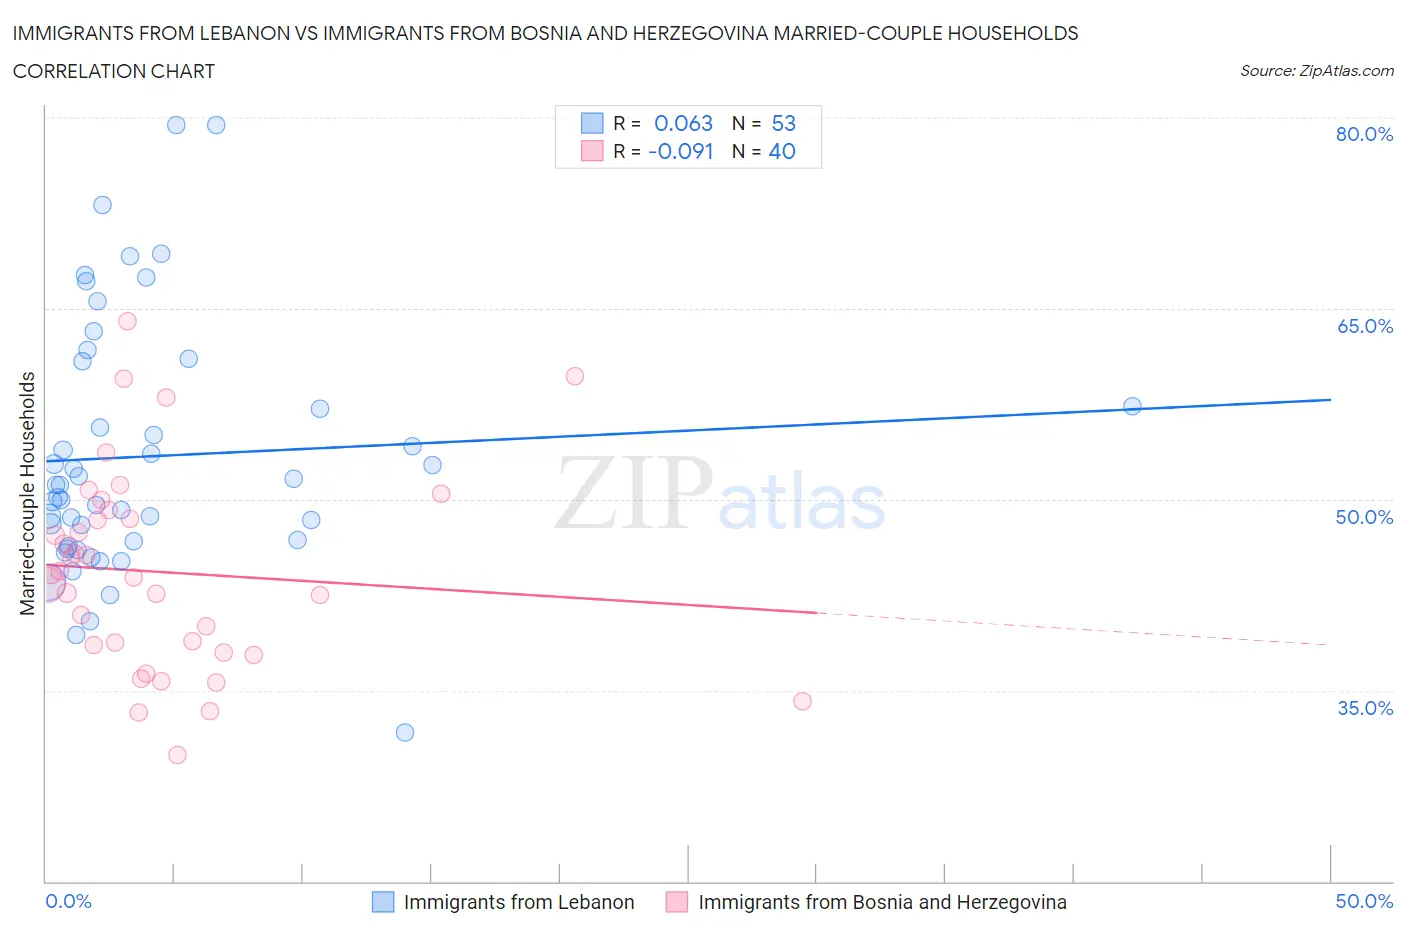
Immigrants from Lebanon vs Immigrants from Bosnia and Herzegovina Married-couple Households Correlation Chart
The statistical analysis conducted on geographies consisting of 217,124,859 people shows a slight positive correlation between the proportion of Immigrants from Lebanon and percentage of married-couple family households in the United States with a correlation coefficient (R) of 0.063 and weighted average of 48.9%. Similarly, the statistical analysis conducted on geographies consisting of 156,805,510 people shows a slight negative correlation between the proportion of Immigrants from Bosnia and Herzegovina and percentage of married-couple family households in the United States with a correlation coefficient (R) of -0.091 and weighted average of 44.4%, a difference of 9.9%.
Married-couple Households Correlation Summary
| Measurement | Immigrants from Lebanon | Immigrants from Bosnia and Herzegovina |
| Minimum | 31.7% | 29.9% |
| Maximum | 79.4% | 64.0% |
| Range | 47.7% | 34.1% |
| Mean | 53.4% | 44.3% |
| Median | 51.1% | 44.0% |
| Interquartile 25% (IQ1) | 46.5% | 38.2% |
| Interquartile 75% (IQ3) | 59.0% | 48.8% |
| Interquartile Range (IQR) | 12.6% | 10.6% |
| Standard Deviation (Sample) | 10.0% | 7.9% |
| Standard Deviation (Population) | 9.9% | 7.8% |
Similar Demographics by Married-couple Households
Demographics Similar to Immigrants from Lebanon by Married-couple Households
In terms of married-couple households, the demographic groups most similar to Immigrants from Lebanon are Immigrants from Bolivia (48.9%, a difference of 0.030%), Lithuanian (48.9%, a difference of 0.050%), Immigrants from Vietnam (48.8%, a difference of 0.050%), Immigrants from Iran (48.8%, a difference of 0.10%), and Greek (48.9%, a difference of 0.13%).
| Demographics | Rating | Rank | Married-couple Households |
| Italians | 99.7 /100 | #34 | Exceptional 49.0% |
| Scottish | 99.7 /100 | #35 | Exceptional 49.0% |
| Iranians | 99.7 /100 | #36 | Exceptional 49.0% |
| Sri Lankans | 99.7 /100 | #37 | Exceptional 49.0% |
| Greeks | 99.7 /100 | #38 | Exceptional 48.9% |
| Lithuanians | 99.6 /100 | #39 | Exceptional 48.9% |
| Immigrants | Bolivia | 99.6 /100 | #40 | Exceptional 48.9% |
| Immigrants | Lebanon | 99.6 /100 | #41 | Exceptional 48.9% |
| Immigrants | Vietnam | 99.6 /100 | #42 | Exceptional 48.8% |
| Immigrants | Iran | 99.6 /100 | #43 | Exceptional 48.8% |
| Welsh | 99.5 /100 | #44 | Exceptional 48.8% |
| Immigrants | Eastern Asia | 99.5 /100 | #45 | Exceptional 48.8% |
| Tsimshian | 99.5 /100 | #46 | Exceptional 48.7% |
| British | 99.5 /100 | #47 | Exceptional 48.7% |
| Indians (Asian) | 99.4 /100 | #48 | Exceptional 48.7% |
Demographics Similar to Immigrants from Bosnia and Herzegovina by Married-couple Households
In terms of married-couple households, the demographic groups most similar to Immigrants from Bosnia and Herzegovina are Ute (44.4%, a difference of 0.0%), Immigrants from Albania (44.4%, a difference of 0.040%), Spanish American (44.5%, a difference of 0.080%), Immigrants from Uruguay (44.5%, a difference of 0.10%), and Immigrants from Saudi Arabia (44.4%, a difference of 0.11%).
| Demographics | Rating | Rank | Married-couple Households |
| Immigrants | Panama | 1.3 /100 | #234 | Tragic 44.6% |
| Immigrants | Nicaragua | 1.2 /100 | #235 | Tragic 44.5% |
| Yaqui | 1.2 /100 | #236 | Tragic 44.5% |
| Comanche | 1.2 /100 | #237 | Tragic 44.5% |
| Immigrants | Uruguay | 1.1 /100 | #238 | Tragic 44.5% |
| Spanish Americans | 1.1 /100 | #239 | Tragic 44.5% |
| Ute | 1.0 /100 | #240 | Tragic 44.4% |
| Immigrants | Bosnia and Herzegovina | 1.0 /100 | #241 | Tragic 44.4% |
| Immigrants | Albania | 1.0 /100 | #242 | Tragic 44.4% |
| Immigrants | Saudi Arabia | 0.9 /100 | #243 | Tragic 44.4% |
| Immigrants | Armenia | 0.7 /100 | #244 | Tragic 44.3% |
| Immigrants | El Salvador | 0.7 /100 | #245 | Tragic 44.3% |
| Immigrants | Cuba | 0.6 /100 | #246 | Tragic 44.2% |
| Immigrants | Morocco | 0.6 /100 | #247 | Tragic 44.2% |
| Yup'ik | 0.4 /100 | #248 | Tragic 44.1% |