Immigrants from West Indies vs Northern European Currently Married
COMPARE
Immigrants from West Indies
Northern European
Currently Married
Currently Married Comparison
Immigrants from West Indies
Northern Europeans
40.7%
CURRENTLY MARRIED
0.0/ 100
METRIC RATING
323rd/ 347
METRIC RANK
48.7%
CURRENTLY MARRIED
99.2/ 100
METRIC RATING
47th/ 347
METRIC RANK
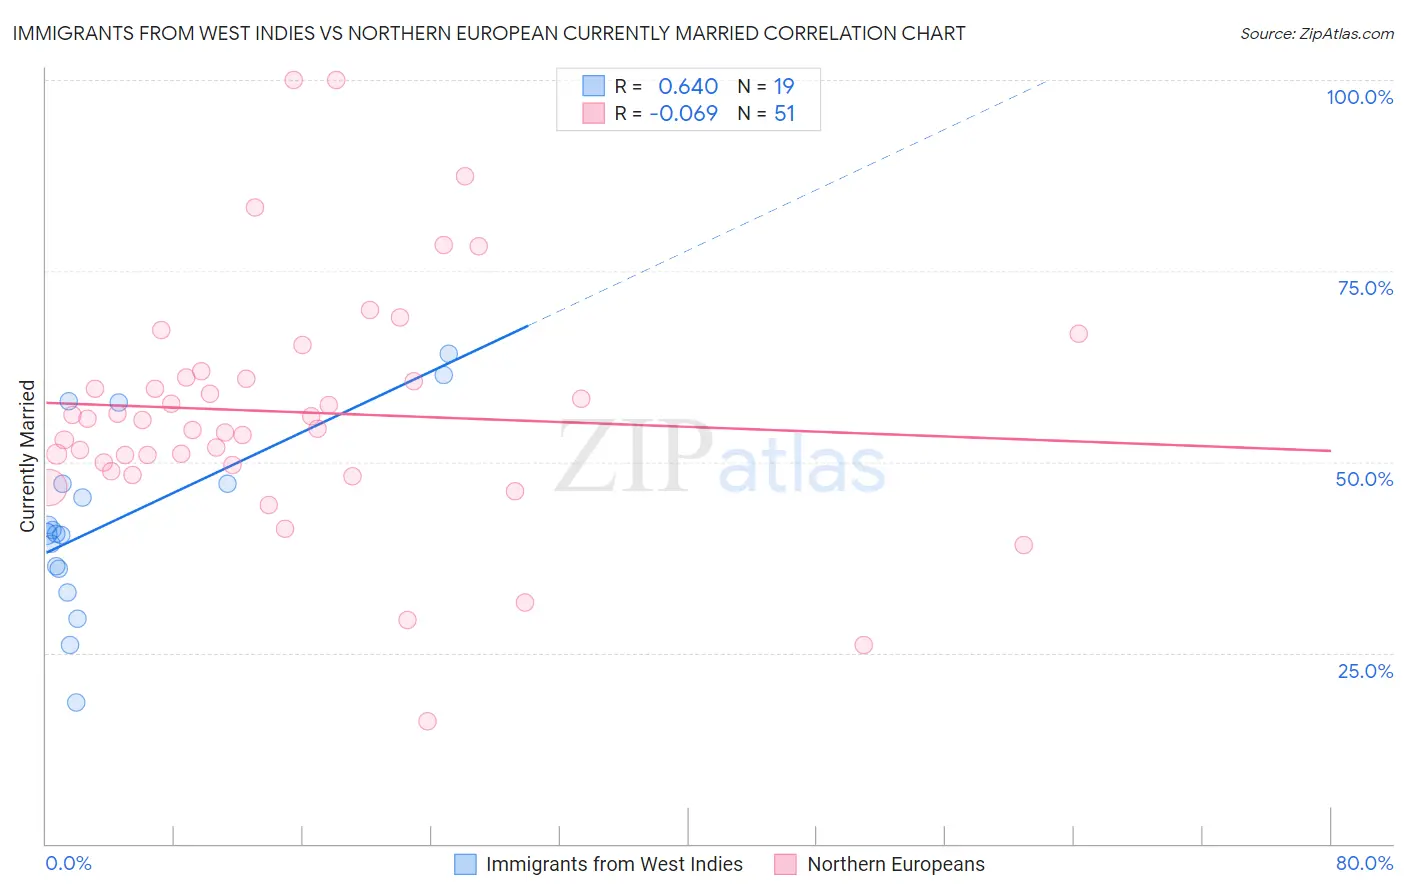
Immigrants from West Indies vs Northern European Currently Married Correlation Chart
The statistical analysis conducted on geographies consisting of 72,457,514 people shows a significant positive correlation between the proportion of Immigrants from West Indies and percentage of population currently married in the United States with a correlation coefficient (R) of 0.640 and weighted average of 40.7%. Similarly, the statistical analysis conducted on geographies consisting of 406,072,050 people shows a slight negative correlation between the proportion of Northern Europeans and percentage of population currently married in the United States with a correlation coefficient (R) of -0.069 and weighted average of 48.7%, a difference of 19.6%.
Currently Married Correlation Summary
| Measurement | Immigrants from West Indies | Northern European |
| Minimum | 18.5% | 16.1% |
| Maximum | 64.2% | 100.0% |
| Range | 45.7% | 83.9% |
| Mean | 42.3% | 56.5% |
| Median | 40.6% | 55.5% |
| Interquartile 25% (IQ1) | 36.1% | 49.5% |
| Interquartile 75% (IQ3) | 47.1% | 61.1% |
| Interquartile Range (IQR) | 11.0% | 11.6% |
| Standard Deviation (Sample) | 11.9% | 15.8% |
| Standard Deviation (Population) | 11.6% | 15.6% |
Similar Demographics by Currently Married
Demographics Similar to Immigrants from West Indies by Currently Married
In terms of currently married, the demographic groups most similar to Immigrants from West Indies are Immigrants from Senegal (40.7%, a difference of 0.010%), U.S. Virgin Islander (40.7%, a difference of 0.060%), Barbadian (40.6%, a difference of 0.20%), Senegalese (40.6%, a difference of 0.37%), and Arapaho (40.5%, a difference of 0.41%).
| Demographics | Rating | Rank | Currently Married |
| Immigrants | Caribbean | 0.0 /100 | #316 | Tragic 41.3% |
| Haitians | 0.0 /100 | #317 | Tragic 41.3% |
| Bahamians | 0.0 /100 | #318 | Tragic 41.2% |
| Immigrants | Somalia | 0.0 /100 | #319 | Tragic 41.2% |
| Immigrants | Jamaica | 0.0 /100 | #320 | Tragic 41.1% |
| Immigrants | Congo | 0.0 /100 | #321 | Tragic 41.1% |
| Immigrants | Haiti | 0.0 /100 | #322 | Tragic 41.0% |
| Immigrants | West Indies | 0.0 /100 | #323 | Tragic 40.7% |
| Immigrants | Senegal | 0.0 /100 | #324 | Tragic 40.7% |
| U.S. Virgin Islanders | 0.0 /100 | #325 | Tragic 40.7% |
| Barbadians | 0.0 /100 | #326 | Tragic 40.6% |
| Senegalese | 0.0 /100 | #327 | Tragic 40.6% |
| Arapaho | 0.0 /100 | #328 | Tragic 40.5% |
| Crow | 0.0 /100 | #329 | Tragic 40.4% |
| Immigrants | Dominica | 0.0 /100 | #330 | Tragic 40.3% |
Demographics Similar to Northern Europeans by Currently Married
In terms of currently married, the demographic groups most similar to Northern Europeans are Immigrants from Iran (48.7%, a difference of 0.010%), Austrian (48.7%, a difference of 0.010%), Belgian (48.7%, a difference of 0.040%), Immigrants from North America (48.7%, a difference of 0.060%), and Scotch-Irish (48.7%, a difference of 0.090%).
| Demographics | Rating | Rank | Currently Married |
| Immigrants | Canada | 99.4 /100 | #40 | Exceptional 48.8% |
| Greeks | 99.3 /100 | #41 | Exceptional 48.8% |
| Finns | 99.3 /100 | #42 | Exceptional 48.8% |
| Scotch-Irish | 99.3 /100 | #43 | Exceptional 48.7% |
| Immigrants | North America | 99.3 /100 | #44 | Exceptional 48.7% |
| Belgians | 99.3 /100 | #45 | Exceptional 48.7% |
| Immigrants | Iran | 99.2 /100 | #46 | Exceptional 48.7% |
| Northern Europeans | 99.2 /100 | #47 | Exceptional 48.7% |
| Austrians | 99.2 /100 | #48 | Exceptional 48.7% |
| Bhutanese | 99.1 /100 | #49 | Exceptional 48.6% |
| Iranians | 99.0 /100 | #50 | Exceptional 48.6% |
| Whites/Caucasians | 99.0 /100 | #51 | Exceptional 48.6% |
| Russians | 98.9 /100 | #52 | Exceptional 48.6% |
| Immigrants | Austria | 98.8 /100 | #53 | Exceptional 48.5% |
| Immigrants | Moldova | 98.7 /100 | #54 | Exceptional 48.5% |