Immigrants from Yemen vs Danish Family Households with Children
COMPARE
Immigrants from Yemen
Danish
Family Households with Children
Family Households with Children Comparison
Immigrants from Yemen
Danes
29.4%
FAMILY HOUSEHOLDS WITH CHILDREN
100.0/ 100
METRIC RATING
32nd/ 347
METRIC RANK
28.7%
FAMILY HOUSEHOLDS WITH CHILDREN
100.0/ 100
METRIC RATING
57th/ 347
METRIC RANK
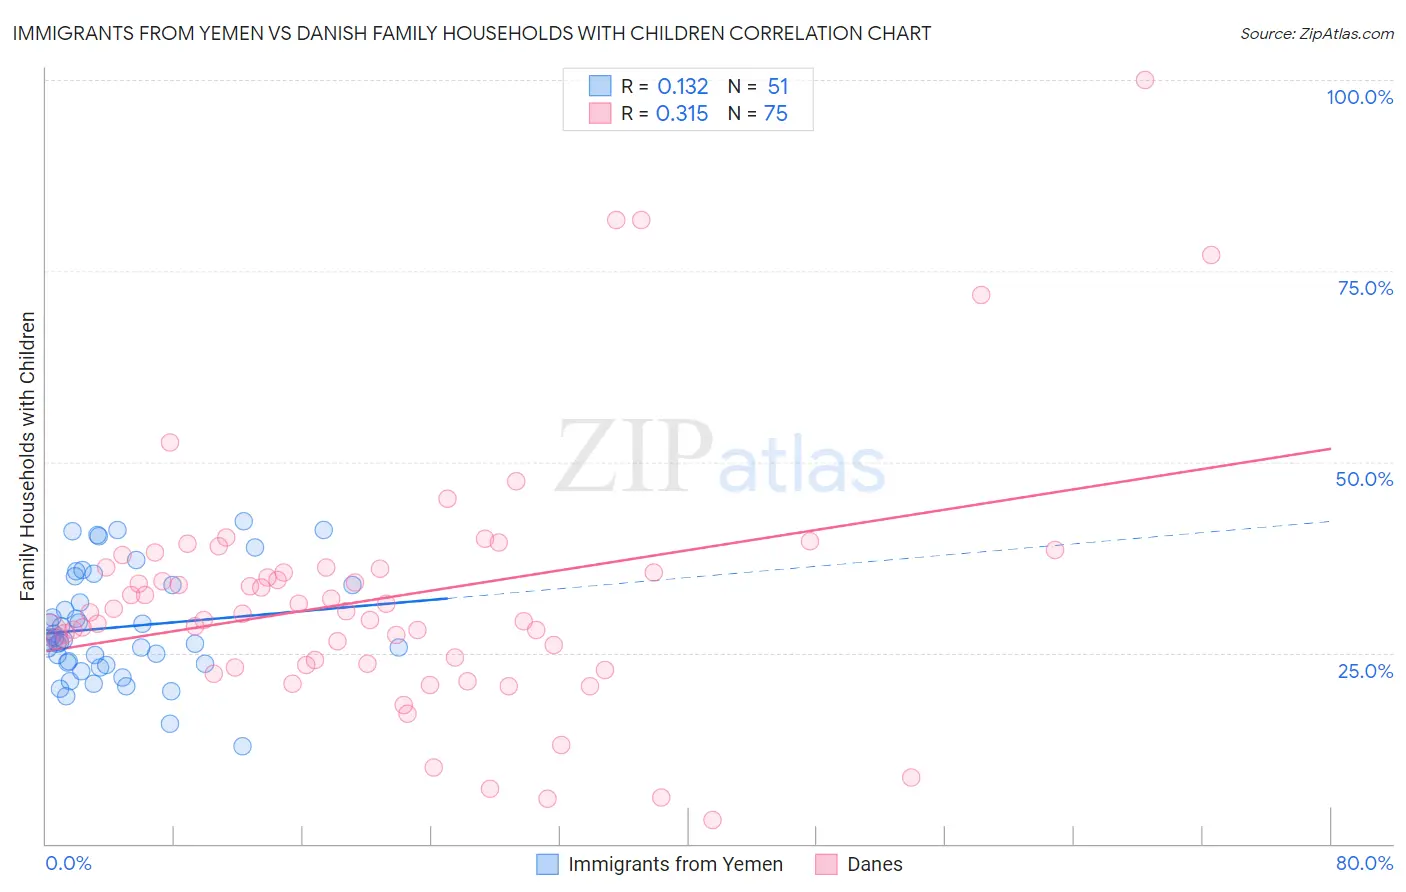
Immigrants from Yemen vs Danish Family Households with Children Correlation Chart
The statistical analysis conducted on geographies consisting of 82,433,611 people shows a poor positive correlation between the proportion of Immigrants from Yemen and percentage of family households with children in the United States with a correlation coefficient (R) of 0.132 and weighted average of 29.4%. Similarly, the statistical analysis conducted on geographies consisting of 473,642,797 people shows a mild positive correlation between the proportion of Danes and percentage of family households with children in the United States with a correlation coefficient (R) of 0.315 and weighted average of 28.7%, a difference of 2.4%.
Family Households with Children Correlation Summary
| Measurement | Immigrants from Yemen | Danish |
| Minimum | 12.8% | 3.0% |
| Maximum | 42.3% | 100.0% |
| Range | 29.4% | 97.0% |
| Mean | 28.4% | 32.3% |
| Median | 26.7% | 30.2% |
| Interquartile 25% (IQ1) | 23.6% | 23.6% |
| Interquartile 75% (IQ3) | 33.9% | 36.1% |
| Interquartile Range (IQR) | 10.4% | 12.5% |
| Standard Deviation (Sample) | 7.1% | 16.7% |
| Standard Deviation (Population) | 7.0% | 16.6% |
Similar Demographics by Family Households with Children
Demographics Similar to Immigrants from Yemen by Family Households with Children
In terms of family households with children, the demographic groups most similar to Immigrants from Yemen are Japanese (29.4%, a difference of 0.060%), Yuman (29.5%, a difference of 0.20%), Venezuelan (29.4%, a difference of 0.20%), Samoan (29.5%, a difference of 0.24%), and Bolivian (29.5%, a difference of 0.24%).
| Demographics | Rating | Rank | Family Households with Children |
| Immigrants | Latin America | 100.0 /100 | #25 | Exceptional 29.7% |
| Sri Lankans | 100.0 /100 | #26 | Exceptional 29.5% |
| Immigrants | Vietnam | 100.0 /100 | #27 | Exceptional 29.5% |
| Samoans | 100.0 /100 | #28 | Exceptional 29.5% |
| Bolivians | 100.0 /100 | #29 | Exceptional 29.5% |
| Yuman | 100.0 /100 | #30 | Exceptional 29.5% |
| Japanese | 100.0 /100 | #31 | Exceptional 29.4% |
| Immigrants | Yemen | 100.0 /100 | #32 | Exceptional 29.4% |
| Venezuelans | 100.0 /100 | #33 | Exceptional 29.4% |
| Immigrants | Bolivia | 100.0 /100 | #34 | Exceptional 29.3% |
| Immigrants | Sierra Leone | 100.0 /100 | #35 | Exceptional 29.3% |
| Immigrants | Venezuela | 100.0 /100 | #36 | Exceptional 29.3% |
| Immigrants | Cameroon | 100.0 /100 | #37 | Exceptional 29.2% |
| Koreans | 100.0 /100 | #38 | Exceptional 29.2% |
| Yaqui | 100.0 /100 | #39 | Exceptional 29.1% |
Demographics Similar to Danes by Family Households with Children
In terms of family households with children, the demographic groups most similar to Danes are Hawaiian (28.7%, a difference of 0.15%), Immigrants from Guatemala (28.8%, a difference of 0.24%), Immigrants from Asia (28.8%, a difference of 0.31%), Sierra Leonean (28.9%, a difference of 0.38%), and Immigrants from Cambodia (28.9%, a difference of 0.45%).
| Demographics | Rating | Rank | Family Households with Children |
| Immigrants | Immigrants | 100.0 /100 | #50 | Exceptional 28.9% |
| Immigrants | Peru | 100.0 /100 | #51 | Exceptional 28.9% |
| Guatemalans | 100.0 /100 | #52 | Exceptional 28.9% |
| Immigrants | Cambodia | 100.0 /100 | #53 | Exceptional 28.9% |
| Sierra Leoneans | 100.0 /100 | #54 | Exceptional 28.9% |
| Immigrants | Asia | 100.0 /100 | #55 | Exceptional 28.8% |
| Immigrants | Guatemala | 100.0 /100 | #56 | Exceptional 28.8% |
| Danes | 100.0 /100 | #57 | Exceptional 28.7% |
| Hawaiians | 100.0 /100 | #58 | Exceptional 28.7% |
| Immigrants | Nigeria | 100.0 /100 | #59 | Exceptional 28.6% |
| Hmong | 99.9 /100 | #60 | Exceptional 28.6% |
| Immigrants | Ghana | 99.9 /100 | #61 | Exceptional 28.6% |
| Egyptians | 99.9 /100 | #62 | Exceptional 28.6% |
| Immigrants | Lebanon | 99.9 /100 | #63 | Exceptional 28.6% |
| Filipinos | 99.9 /100 | #64 | Exceptional 28.6% |