Immigrants from Caribbean vs Kiowa Births to Unmarried Women
COMPARE
Immigrants from Caribbean
Kiowa
Births to Unmarried Women
Births to Unmarried Women Comparison
Immigrants from Caribbean
Kiowa
39.8%
BIRTHS TO UNMARRIED WOMEN
0.0/ 100
METRIC RATING
314th/ 347
METRIC RANK
43.1%
BIRTHS TO UNMARRIED WOMEN
0.0/ 100
METRIC RATING
332nd/ 347
METRIC RANK
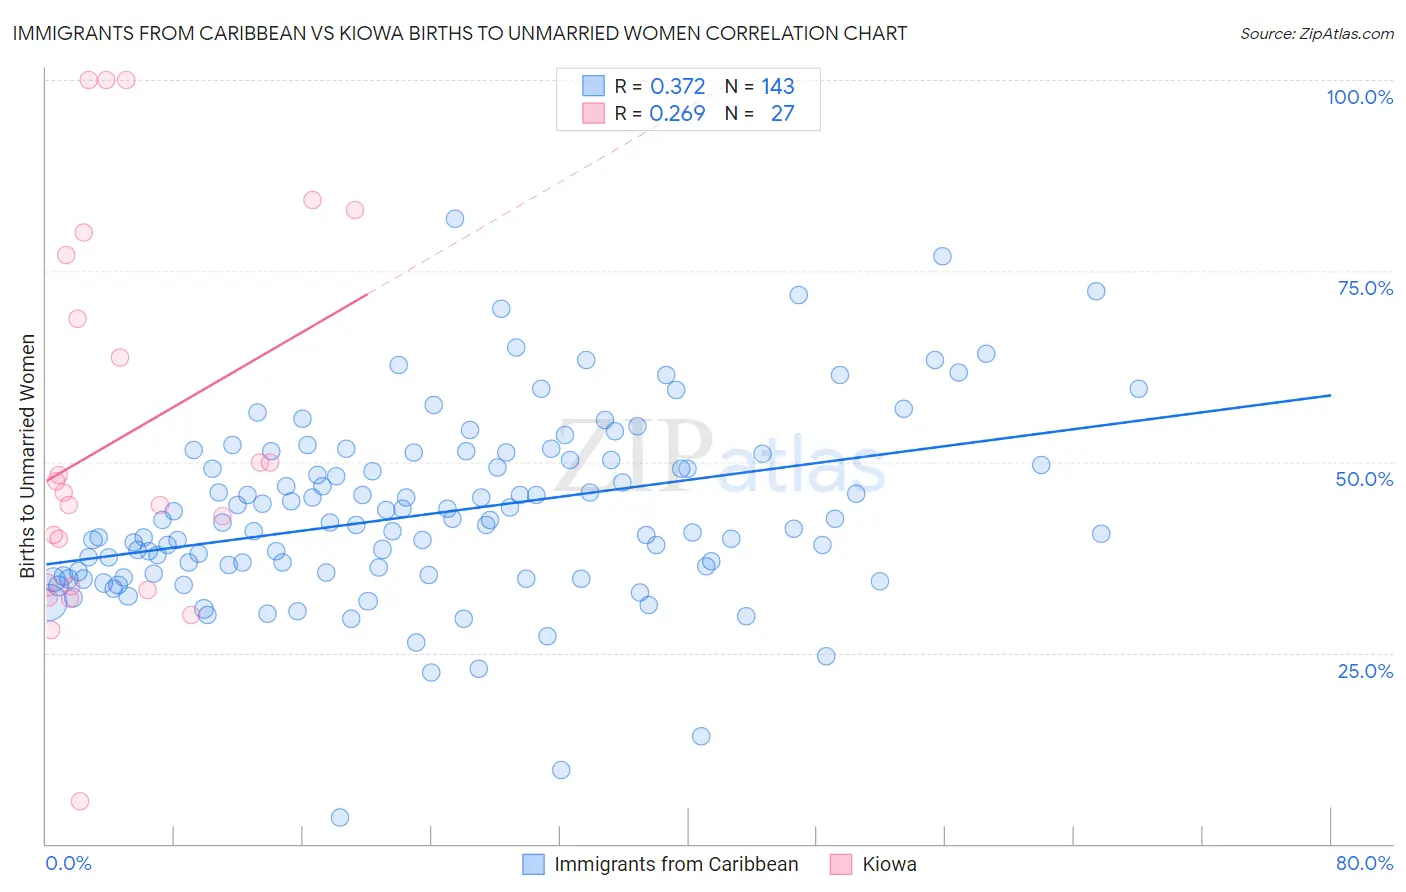
Immigrants from Caribbean vs Kiowa Births to Unmarried Women Correlation Chart
The statistical analysis conducted on geographies consisting of 417,835,759 people shows a mild positive correlation between the proportion of Immigrants from Caribbean and percentage of births to unmarried women in the United States with a correlation coefficient (R) of 0.372 and weighted average of 39.8%. Similarly, the statistical analysis conducted on geographies consisting of 55,598,383 people shows a weak positive correlation between the proportion of Kiowa and percentage of births to unmarried women in the United States with a correlation coefficient (R) of 0.269 and weighted average of 43.1%, a difference of 8.3%.
Births to Unmarried Women Correlation Summary
| Measurement | Immigrants from Caribbean | Kiowa |
| Minimum | 3.4% | 5.6% |
| Maximum | 81.8% | 100.0% |
| Range | 78.4% | 94.4% |
| Mean | 43.3% | 53.3% |
| Median | 42.0% | 46.0% |
| Interquartile 25% (IQ1) | 35.4% | 33.8% |
| Interquartile 75% (IQ3) | 50.3% | 77.0% |
| Interquartile Range (IQR) | 15.0% | 43.2% |
| Standard Deviation (Sample) | 12.1% | 25.0% |
| Standard Deviation (Population) | 12.0% | 24.5% |
Demographics Similar to Immigrants from Caribbean and Kiowa by Births to Unmarried Women
In terms of births to unmarried women, the demographic groups most similar to Immigrants from Caribbean are Dominican (39.8%, a difference of 0.040%), Apache (39.9%, a difference of 0.10%), African (39.7%, a difference of 0.29%), Immigrants from Dominican Republic (40.1%, a difference of 0.65%), and Immigrants from Bahamas (40.1%, a difference of 0.72%). Similarly, the demographic groups most similar to Kiowa are Native/Alaskan (43.0%, a difference of 0.35%), Chippewa (42.6%, a difference of 1.2%), Paiute (42.5%, a difference of 1.6%), Immigrants from Cabo Verde (42.2%, a difference of 2.2%), and Tsimshian (42.2%, a difference of 2.3%).
| Demographics | Rating | Rank | Births to Unmarried Women |
| Africans | 0.0 /100 | #313 | Tragic 39.7% |
| Immigrants | Caribbean | 0.0 /100 | #314 | Tragic 39.8% |
| Dominicans | 0.0 /100 | #315 | Tragic 39.8% |
| Apache | 0.0 /100 | #316 | Tragic 39.9% |
| Immigrants | Dominican Republic | 0.0 /100 | #317 | Tragic 40.1% |
| Immigrants | Bahamas | 0.0 /100 | #318 | Tragic 40.1% |
| Yakama | 0.0 /100 | #319 | Tragic 40.3% |
| Crow | 0.0 /100 | #320 | Tragic 40.4% |
| Bahamians | 0.0 /100 | #321 | Tragic 40.8% |
| Cajuns | 0.0 /100 | #322 | Tragic 41.0% |
| Sioux | 0.0 /100 | #323 | Tragic 41.0% |
| Cape Verdeans | 0.0 /100 | #324 | Tragic 41.3% |
| Cheyenne | 0.0 /100 | #325 | Tragic 41.3% |
| Immigrants | Cuba | 0.0 /100 | #326 | Tragic 41.5% |
| Tsimshian | 0.0 /100 | #327 | Tragic 42.2% |
| Immigrants | Cabo Verde | 0.0 /100 | #328 | Tragic 42.2% |
| Paiute | 0.0 /100 | #329 | Tragic 42.5% |
| Chippewa | 0.0 /100 | #330 | Tragic 42.6% |
| Natives/Alaskans | 0.0 /100 | #331 | Tragic 43.0% |
| Kiowa | 0.0 /100 | #332 | Tragic 43.1% |
| Blacks/African Americans | 0.0 /100 | #333 | Tragic 44.3% |