Immigrants from Latin America vs Ethiopian Currently Married
COMPARE
Immigrants from Latin America
Ethiopian
Currently Married
Currently Married Comparison
Immigrants from Latin America
Ethiopians
43.8%
CURRENTLY MARRIED
0.1/ 100
METRIC RATING
260th/ 347
METRIC RANK
44.5%
CURRENTLY MARRIED
0.7/ 100
METRIC RATING
241st/ 347
METRIC RANK
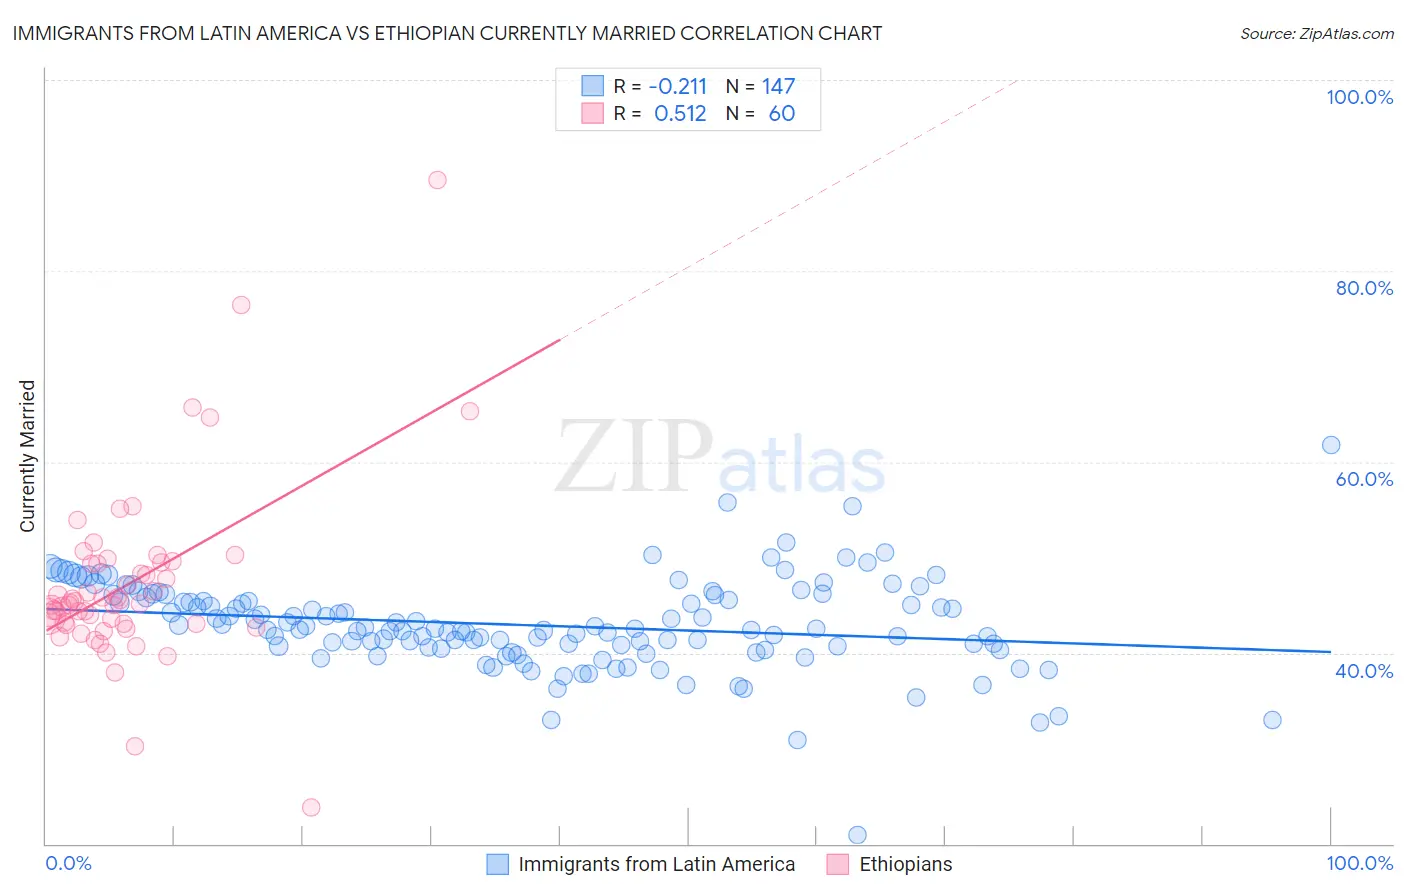
Immigrants from Latin America vs Ethiopian Currently Married Correlation Chart
The statistical analysis conducted on geographies consisting of 558,538,971 people shows a weak negative correlation between the proportion of Immigrants from Latin America and percentage of population currently married in the United States with a correlation coefficient (R) of -0.211 and weighted average of 43.8%. Similarly, the statistical analysis conducted on geographies consisting of 223,255,094 people shows a substantial positive correlation between the proportion of Ethiopians and percentage of population currently married in the United States with a correlation coefficient (R) of 0.512 and weighted average of 44.5%, a difference of 1.7%.
Currently Married Correlation Summary
| Measurement | Immigrants from Latin America | Ethiopian |
| Minimum | 20.9% | 23.8% |
| Maximum | 61.8% | 89.5% |
| Range | 40.9% | 65.7% |
| Mean | 42.9% | 47.3% |
| Median | 42.5% | 45.2% |
| Interquartile 25% (IQ1) | 40.6% | 43.0% |
| Interquartile 75% (IQ3) | 45.8% | 49.4% |
| Interquartile Range (IQR) | 5.2% | 6.3% |
| Standard Deviation (Sample) | 4.8% | 9.5% |
| Standard Deviation (Population) | 4.8% | 9.4% |
Demographics Similar to Immigrants from Latin America and Ethiopians by Currently Married
In terms of currently married, the demographic groups most similar to Immigrants from Latin America are Immigrants from Sierra Leone (43.8%, a difference of 0.060%), Ute (43.9%, a difference of 0.27%), Immigrants from Africa (43.9%, a difference of 0.28%), Shoshone (44.0%, a difference of 0.48%), and Yakama (44.0%, a difference of 0.53%). Similarly, the demographic groups most similar to Ethiopians are Immigrants from Cambodia (44.5%, a difference of 0.030%), Immigrants from Ethiopia (44.5%, a difference of 0.040%), Mexican American Indian (44.5%, a difference of 0.060%), Japanese (44.5%, a difference of 0.12%), and Immigrants from Armenia (44.3%, a difference of 0.43%).
| Demographics | Rating | Rank | Currently Married |
| Mexican American Indians | 0.7 /100 | #240 | Tragic 44.5% |
| Ethiopians | 0.7 /100 | #241 | Tragic 44.5% |
| Immigrants | Cambodia | 0.7 /100 | #242 | Tragic 44.5% |
| Immigrants | Ethiopia | 0.7 /100 | #243 | Tragic 44.5% |
| Japanese | 0.6 /100 | #244 | Tragic 44.5% |
| Immigrants | Armenia | 0.4 /100 | #245 | Tragic 44.3% |
| Immigrants | Burma/Myanmar | 0.4 /100 | #246 | Tragic 44.3% |
| Ugandans | 0.4 /100 | #247 | Tragic 44.2% |
| Nicaraguans | 0.3 /100 | #248 | Tragic 44.2% |
| Immigrants | Cameroon | 0.3 /100 | #249 | Tragic 44.2% |
| Immigrants | Eastern Africa | 0.3 /100 | #250 | Tragic 44.2% |
| Blackfeet | 0.3 /100 | #251 | Tragic 44.2% |
| Hispanics or Latinos | 0.3 /100 | #252 | Tragic 44.1% |
| Immigrants | Central America | 0.3 /100 | #253 | Tragic 44.1% |
| Vietnamese | 0.2 /100 | #254 | Tragic 44.0% |
| Yakama | 0.2 /100 | #255 | Tragic 44.0% |
| Shoshone | 0.2 /100 | #256 | Tragic 44.0% |
| Immigrants | Africa | 0.2 /100 | #257 | Tragic 43.9% |
| Ute | 0.2 /100 | #258 | Tragic 43.9% |
| Immigrants | Sierra Leone | 0.1 /100 | #259 | Tragic 43.8% |
| Immigrants | Latin America | 0.1 /100 | #260 | Tragic 43.8% |