Immigrants from Laos vs Portuguese Single Father Households
COMPARE
Immigrants from Laos
Portuguese
Single Father Households
Single Father Households Comparison
Immigrants from Laos
Portuguese
2.9%
SINGLE FATHER HOUSEHOLDS
0.0/ 100
METRIC RATING
310th/ 347
METRIC RANK
2.5%
SINGLE FATHER HOUSEHOLDS
4.1/ 100
METRIC RATING
241st/ 347
METRIC RANK
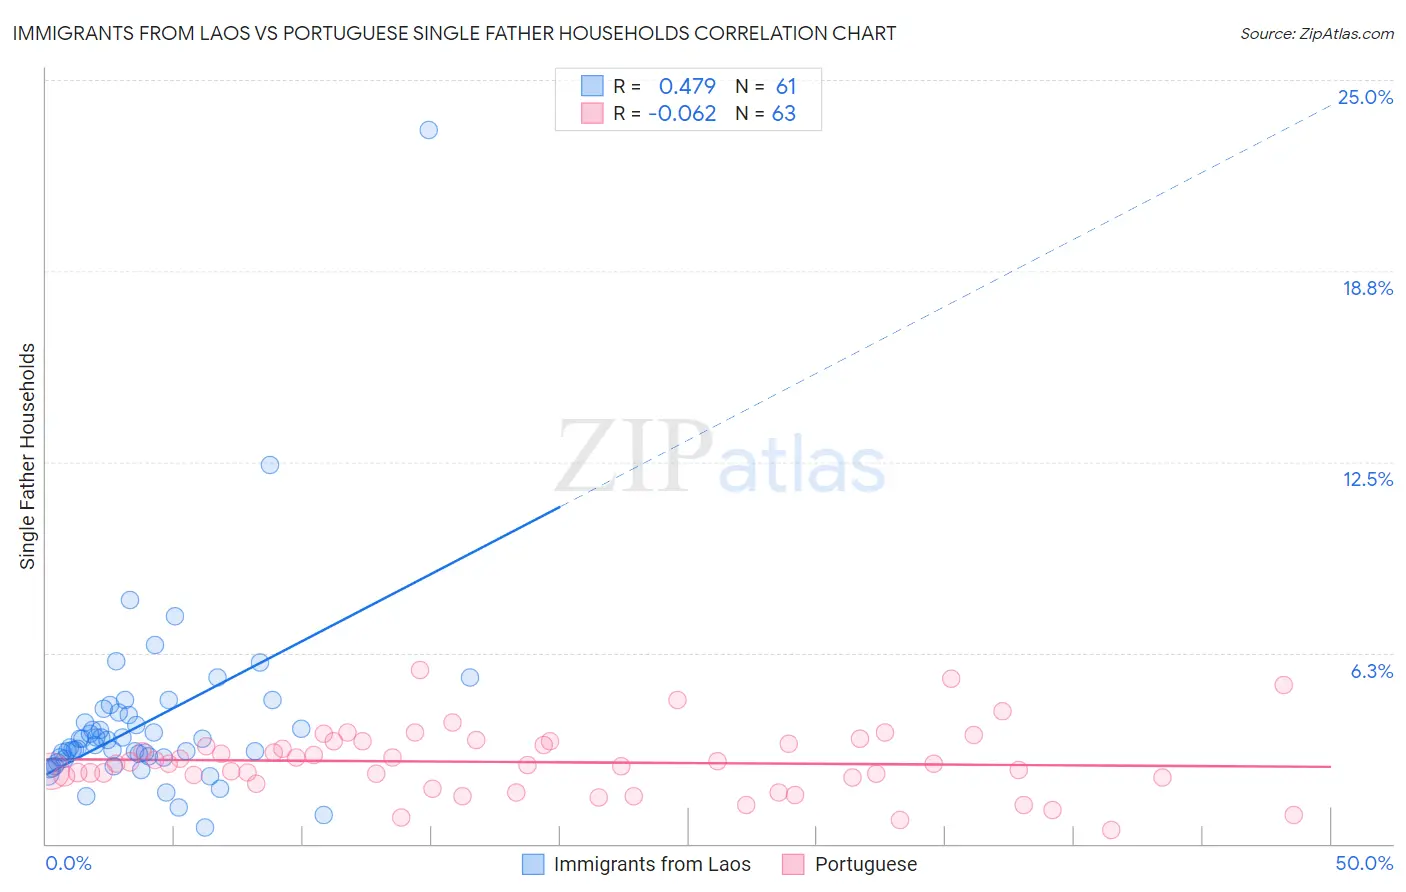
Immigrants from Laos vs Portuguese Single Father Households Correlation Chart
The statistical analysis conducted on geographies consisting of 201,026,896 people shows a moderate positive correlation between the proportion of Immigrants from Laos and percentage of single father households in the United States with a correlation coefficient (R) of 0.479 and weighted average of 2.9%. Similarly, the statistical analysis conducted on geographies consisting of 444,369,792 people shows a slight negative correlation between the proportion of Portuguese and percentage of single father households in the United States with a correlation coefficient (R) of -0.062 and weighted average of 2.5%, a difference of 15.7%.
Single Father Households Correlation Summary
| Measurement | Immigrants from Laos | Portuguese |
| Minimum | 0.53% | 0.46% |
| Maximum | 23.4% | 5.7% |
| Range | 22.8% | 5.2% |
| Mean | 4.0% | 2.7% |
| Median | 3.2% | 2.6% |
| Interquartile 25% (IQ1) | 2.8% | 2.2% |
| Interquartile 75% (IQ3) | 4.3% | 3.3% |
| Interquartile Range (IQR) | 1.5% | 1.2% |
| Standard Deviation (Sample) | 3.1% | 1.1% |
| Standard Deviation (Population) | 3.1% | 1.1% |
Similar Demographics by Single Father Households
Demographics Similar to Immigrants from Laos by Single Father Households
In terms of single father households, the demographic groups most similar to Immigrants from Laos are Central American (2.9%, a difference of 0.21%), Spanish American Indian (2.9%, a difference of 0.48%), Apache (2.8%, a difference of 0.92%), Tsimshian (2.9%, a difference of 1.1%), and Hopi (2.8%, a difference of 1.1%).
| Demographics | Rating | Rank | Single Father Households |
| Immigrants | Honduras | 0.0 /100 | #303 | Tragic 2.8% |
| Mexican American Indians | 0.0 /100 | #304 | Tragic 2.8% |
| Hispanics or Latinos | 0.0 /100 | #305 | Tragic 2.8% |
| Immigrants | Azores | 0.0 /100 | #306 | Tragic 2.8% |
| Hopi | 0.0 /100 | #307 | Tragic 2.8% |
| Apache | 0.0 /100 | #308 | Tragic 2.8% |
| Central Americans | 0.0 /100 | #309 | Tragic 2.9% |
| Immigrants | Laos | 0.0 /100 | #310 | Tragic 2.9% |
| Spanish American Indians | 0.0 /100 | #311 | Tragic 2.9% |
| Tsimshian | 0.0 /100 | #312 | Tragic 2.9% |
| Arapaho | 0.0 /100 | #313 | Tragic 2.9% |
| Salvadorans | 0.0 /100 | #314 | Tragic 2.9% |
| Cheyenne | 0.0 /100 | #315 | Tragic 2.9% |
| Houma | 0.0 /100 | #316 | Tragic 2.9% |
| Immigrants | El Salvador | 0.0 /100 | #317 | Tragic 2.9% |
Demographics Similar to Portuguese by Single Father Households
In terms of single father households, the demographic groups most similar to Portuguese are Osage (2.5%, a difference of 0.030%), Immigrants from Dominica (2.5%, a difference of 0.26%), Spaniard (2.5%, a difference of 0.50%), Immigrants from Oceania (2.5%, a difference of 0.62%), and Immigrants from Sierra Leone (2.5%, a difference of 0.63%).
| Demographics | Rating | Rank | Single Father Households |
| Africans | 6.3 /100 | #234 | Tragic 2.5% |
| Immigrants | Immigrants | 6.3 /100 | #235 | Tragic 2.5% |
| Cajuns | 6.1 /100 | #236 | Tragic 2.5% |
| Sierra Leoneans | 5.9 /100 | #237 | Tragic 2.5% |
| Immigrants | Sierra Leone | 5.8 /100 | #238 | Tragic 2.5% |
| Immigrants | Oceania | 5.8 /100 | #239 | Tragic 2.5% |
| Immigrants | Dominica | 4.8 /100 | #240 | Tragic 2.5% |
| Portuguese | 4.1 /100 | #241 | Tragic 2.5% |
| Osage | 4.1 /100 | #242 | Tragic 2.5% |
| Spaniards | 3.1 /100 | #243 | Tragic 2.5% |
| Immigrants | Middle Africa | 2.8 /100 | #244 | Tragic 2.5% |
| Basques | 2.5 /100 | #245 | Tragic 2.5% |
| Native Hawaiians | 2.5 /100 | #246 | Tragic 2.5% |
| Delaware | 2.5 /100 | #247 | Tragic 2.5% |
| Bahamians | 2.4 /100 | #248 | Tragic 2.5% |