Immigrants from Laos vs Mexican Professional Degree
COMPARE
Immigrants from Laos
Mexican
Professional Degree
Professional Degree Comparison
Immigrants from Laos
Mexicans
3.2%
PROFESSIONAL DEGREE
0.1/ 100
METRIC RATING
315th/ 347
METRIC RANK
2.7%
PROFESSIONAL DEGREE
0.0/ 100
METRIC RATING
343rd/ 347
METRIC RANK
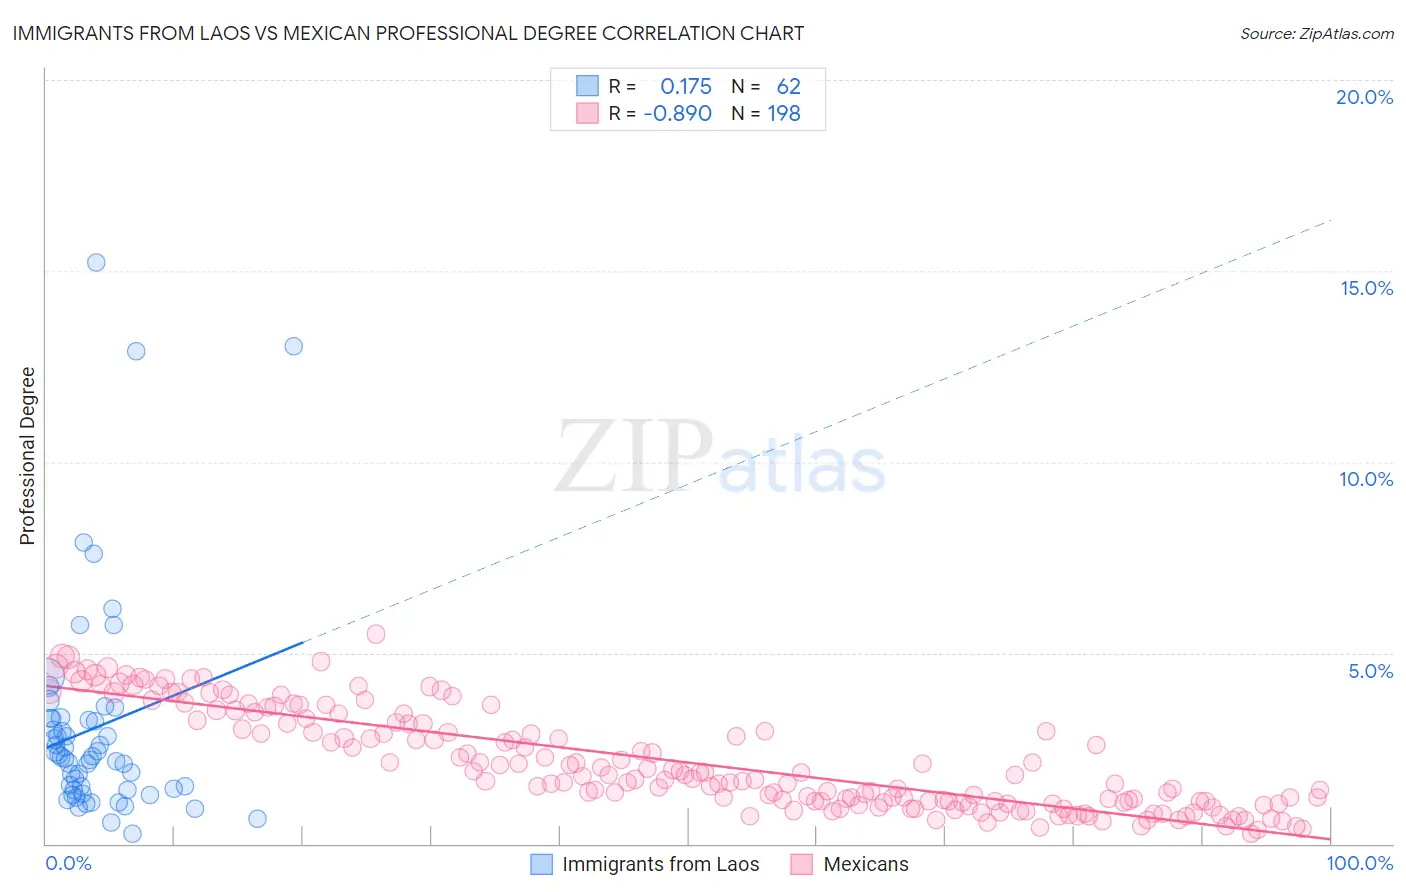
Immigrants from Laos vs Mexican Professional Degree Correlation Chart
The statistical analysis conducted on geographies consisting of 201,278,168 people shows a poor positive correlation between the proportion of Immigrants from Laos and percentage of population with at least professional degree education in the United States with a correlation coefficient (R) of 0.175 and weighted average of 3.2%. Similarly, the statistical analysis conducted on geographies consisting of 557,026,409 people shows a very strong negative correlation between the proportion of Mexicans and percentage of population with at least professional degree education in the United States with a correlation coefficient (R) of -0.890 and weighted average of 2.7%, a difference of 18.0%.
Professional Degree Correlation Summary
| Measurement | Immigrants from Laos | Mexican |
| Minimum | 0.26% | 0.25% |
| Maximum | 15.2% | 5.5% |
| Range | 15.0% | 5.2% |
| Mean | 3.1% | 2.1% |
| Median | 2.3% | 1.7% |
| Interquartile 25% (IQ1) | 1.4% | 1.1% |
| Interquartile 75% (IQ3) | 3.3% | 3.2% |
| Interquartile Range (IQR) | 1.9% | 2.1% |
| Standard Deviation (Sample) | 2.9% | 1.3% |
| Standard Deviation (Population) | 2.9% | 1.3% |
Similar Demographics by Professional Degree
Demographics Similar to Immigrants from Laos by Professional Degree
In terms of professional degree, the demographic groups most similar to Immigrants from Laos are Puerto Rican (3.2%, a difference of 0.010%), Nepalese (3.2%, a difference of 0.22%), Immigrants from Micronesia (3.2%, a difference of 0.25%), Choctaw (3.2%, a difference of 0.50%), and Mexican American Indian (3.3%, a difference of 0.68%).
| Demographics | Rating | Rank | Professional Degree |
| Shoshone | 0.1 /100 | #308 | Tragic 3.3% |
| Pima | 0.1 /100 | #309 | Tragic 3.3% |
| Immigrants | Latin America | 0.1 /100 | #310 | Tragic 3.3% |
| Cherokee | 0.1 /100 | #311 | Tragic 3.3% |
| Sioux | 0.1 /100 | #312 | Tragic 3.3% |
| Yuman | 0.1 /100 | #313 | Tragic 3.3% |
| Mexican American Indians | 0.1 /100 | #314 | Tragic 3.3% |
| Immigrants | Laos | 0.1 /100 | #315 | Tragic 3.2% |
| Puerto Ricans | 0.1 /100 | #316 | Tragic 3.2% |
| Nepalese | 0.1 /100 | #317 | Tragic 3.2% |
| Immigrants | Micronesia | 0.1 /100 | #318 | Tragic 3.2% |
| Choctaw | 0.1 /100 | #319 | Tragic 3.2% |
| Seminole | 0.1 /100 | #320 | Tragic 3.2% |
| Tsimshian | 0.0 /100 | #321 | Tragic 3.2% |
| Hispanics or Latinos | 0.0 /100 | #322 | Tragic 3.2% |
Demographics Similar to Mexicans by Professional Degree
In terms of professional degree, the demographic groups most similar to Mexicans are Immigrants from the Azores (2.8%, a difference of 2.8%), Tohono O'odham (2.8%, a difference of 3.5%), Spanish American Indian (2.7%, a difference of 3.6%), Immigrants from Mexico (2.6%, a difference of 4.0%), and Yup'ik (2.9%, a difference of 4.3%).
| Demographics | Rating | Rank | Professional Degree |
| Puget Sound Salish | 0.0 /100 | #333 | Tragic 3.1% |
| Pennsylvania Germans | 0.0 /100 | #334 | Tragic 3.0% |
| Natives/Alaskans | 0.0 /100 | #335 | Tragic 3.0% |
| Fijians | 0.0 /100 | #336 | Tragic 2.9% |
| Arapaho | 0.0 /100 | #337 | Tragic 2.9% |
| Navajo | 0.0 /100 | #338 | Tragic 2.9% |
| Immigrants | Central America | 0.0 /100 | #339 | Tragic 2.9% |
| Yup'ik | 0.0 /100 | #340 | Tragic 2.9% |
| Tohono O'odham | 0.0 /100 | #341 | Tragic 2.8% |
| Immigrants | Azores | 0.0 /100 | #342 | Tragic 2.8% |
| Mexicans | 0.0 /100 | #343 | Tragic 2.7% |
| Spanish American Indians | 0.0 /100 | #344 | Tragic 2.7% |
| Immigrants | Mexico | 0.0 /100 | #345 | Tragic 2.6% |
| Lumbee | 0.0 /100 | #346 | Tragic 2.5% |
| Houma | 0.0 /100 | #347 | Tragic 2.2% |