Immigrants from Korea vs Spanish Currently Married
COMPARE
Immigrants from Korea
Spanish
Currently Married
Currently Married Comparison
Immigrants from Korea
Spanish
49.0%
CURRENTLY MARRIED
99.6/ 100
METRIC RATING
26th/ 347
METRIC RANK
47.0%
CURRENTLY MARRIED
68.1/ 100
METRIC RATING
156th/ 347
METRIC RANK
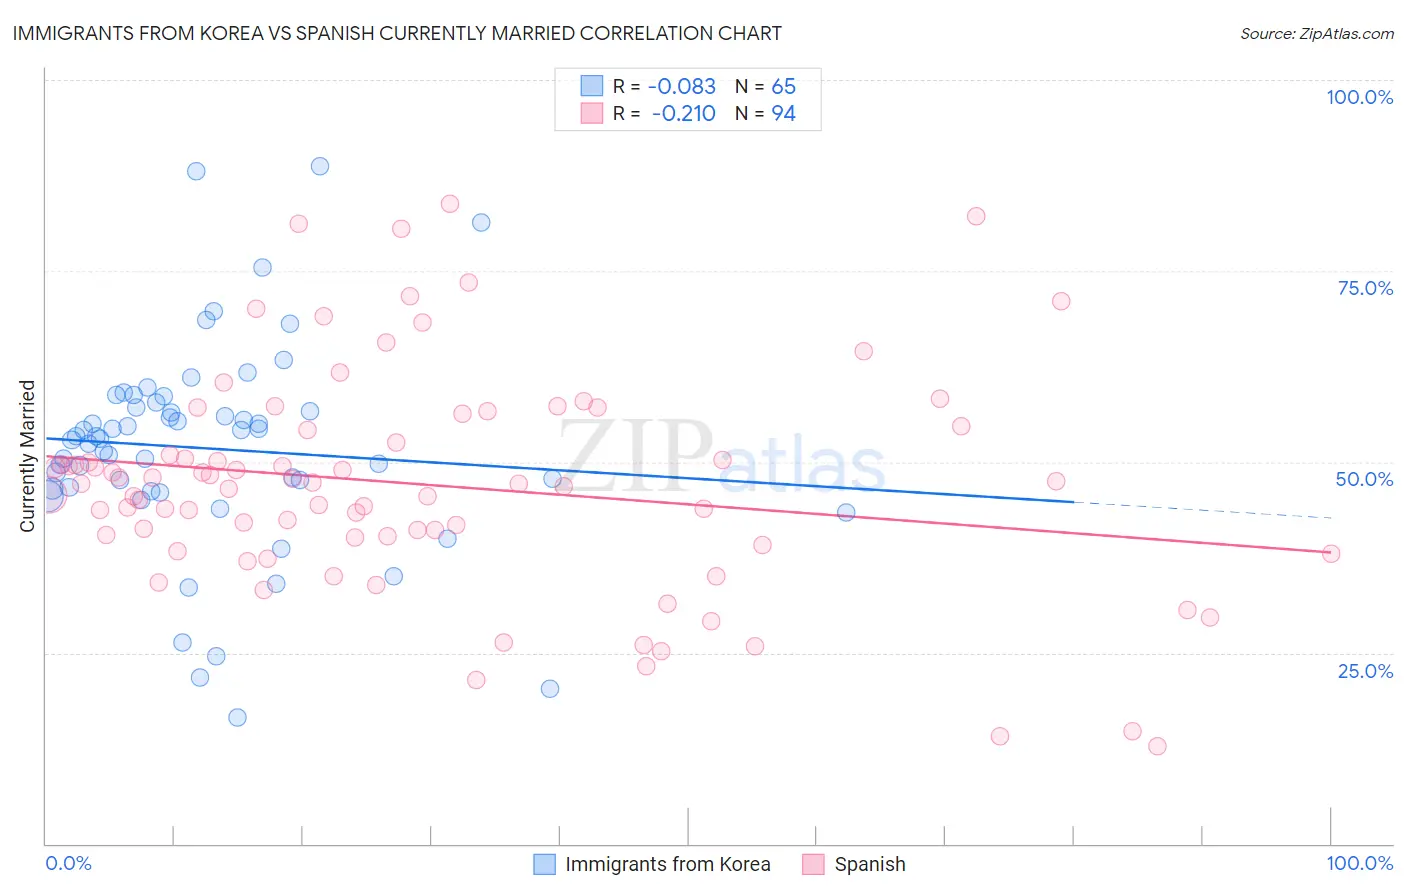
Immigrants from Korea vs Spanish Currently Married Correlation Chart
The statistical analysis conducted on geographies consisting of 416,263,579 people shows a slight negative correlation between the proportion of Immigrants from Korea and percentage of population currently married in the United States with a correlation coefficient (R) of -0.083 and weighted average of 49.0%. Similarly, the statistical analysis conducted on geographies consisting of 422,154,276 people shows a weak negative correlation between the proportion of Spanish and percentage of population currently married in the United States with a correlation coefficient (R) of -0.210 and weighted average of 47.0%, a difference of 4.3%.
Currently Married Correlation Summary
| Measurement | Immigrants from Korea | Spanish |
| Minimum | 16.6% | 12.8% |
| Maximum | 88.7% | 83.7% |
| Range | 72.1% | 70.9% |
| Mean | 51.8% | 47.0% |
| Median | 53.0% | 47.2% |
| Interquartile 25% (IQ1) | 46.4% | 40.1% |
| Interquartile 75% (IQ3) | 57.5% | 54.2% |
| Interquartile Range (IQR) | 11.1% | 14.1% |
| Standard Deviation (Sample) | 13.7% | 14.5% |
| Standard Deviation (Population) | 13.6% | 14.4% |
Similar Demographics by Currently Married
Demographics Similar to Immigrants from Korea by Currently Married
In terms of currently married, the demographic groups most similar to Immigrants from Korea are Maltese (49.0%, a difference of 0.050%), Lithuanian (49.0%, a difference of 0.060%), Burmese (48.9%, a difference of 0.070%), Welsh (48.9%, a difference of 0.11%), and Croatian (48.9%, a difference of 0.15%).
| Demographics | Rating | Rank | Currently Married |
| Europeans | 99.8 /100 | #19 | Exceptional 49.3% |
| Luxembourgers | 99.8 /100 | #20 | Exceptional 49.3% |
| Scottish | 99.8 /100 | #21 | Exceptional 49.2% |
| Bulgarians | 99.7 /100 | #22 | Exceptional 49.1% |
| Immigrants | Pakistan | 99.7 /100 | #23 | Exceptional 49.1% |
| Lithuanians | 99.6 /100 | #24 | Exceptional 49.0% |
| Maltese | 99.6 /100 | #25 | Exceptional 49.0% |
| Immigrants | Korea | 99.6 /100 | #26 | Exceptional 49.0% |
| Burmese | 99.6 /100 | #27 | Exceptional 48.9% |
| Welsh | 99.5 /100 | #28 | Exceptional 48.9% |
| Croatians | 99.5 /100 | #29 | Exceptional 48.9% |
| Eastern Europeans | 99.5 /100 | #30 | Exceptional 48.9% |
| Poles | 99.5 /100 | #31 | Exceptional 48.9% |
| Immigrants | Hong Kong | 99.5 /100 | #32 | Exceptional 48.9% |
| Irish | 99.5 /100 | #33 | Exceptional 48.9% |
Demographics Similar to Spanish by Currently Married
In terms of currently married, the demographic groups most similar to Spanish are Immigrants from Switzerland (46.9%, a difference of 0.010%), Immigrants from Venezuela (47.0%, a difference of 0.020%), Albanian (47.0%, a difference of 0.020%), Arab (47.0%, a difference of 0.020%), and Immigrants from Serbia (47.0%, a difference of 0.030%).
| Demographics | Rating | Rank | Currently Married |
| Zimbabweans | 70.1 /100 | #149 | Good 47.0% |
| Immigrants | Turkey | 70.0 /100 | #150 | Good 47.0% |
| Chileans | 69.8 /100 | #151 | Good 47.0% |
| Immigrants | Serbia | 68.8 /100 | #152 | Good 47.0% |
| Immigrants | Venezuela | 68.6 /100 | #153 | Good 47.0% |
| Albanians | 68.6 /100 | #154 | Good 47.0% |
| Arabs | 68.6 /100 | #155 | Good 47.0% |
| Spanish | 68.1 /100 | #156 | Good 47.0% |
| Immigrants | Switzerland | 67.8 /100 | #157 | Good 46.9% |
| Cherokee | 66.8 /100 | #158 | Good 46.9% |
| Iraqis | 66.4 /100 | #159 | Good 46.9% |
| Immigrants | Uzbekistan | 66.0 /100 | #160 | Good 46.9% |
| Immigrants | Southern Europe | 65.9 /100 | #161 | Good 46.9% |
| Immigrants | Nonimmigrants | 65.4 /100 | #162 | Good 46.9% |
| Delaware | 64.7 /100 | #163 | Good 46.9% |