Immigrants from Korea vs Spanish 11th Grade
COMPARE
Immigrants from Korea
Spanish
11th Grade
11th Grade Comparison
Immigrants from Korea
Spanish
93.3%
11TH GRADE
97.0/ 100
METRIC RATING
118th/ 347
METRIC RANK
92.7%
11TH GRADE
66.2/ 100
METRIC RATING
164th/ 347
METRIC RANK
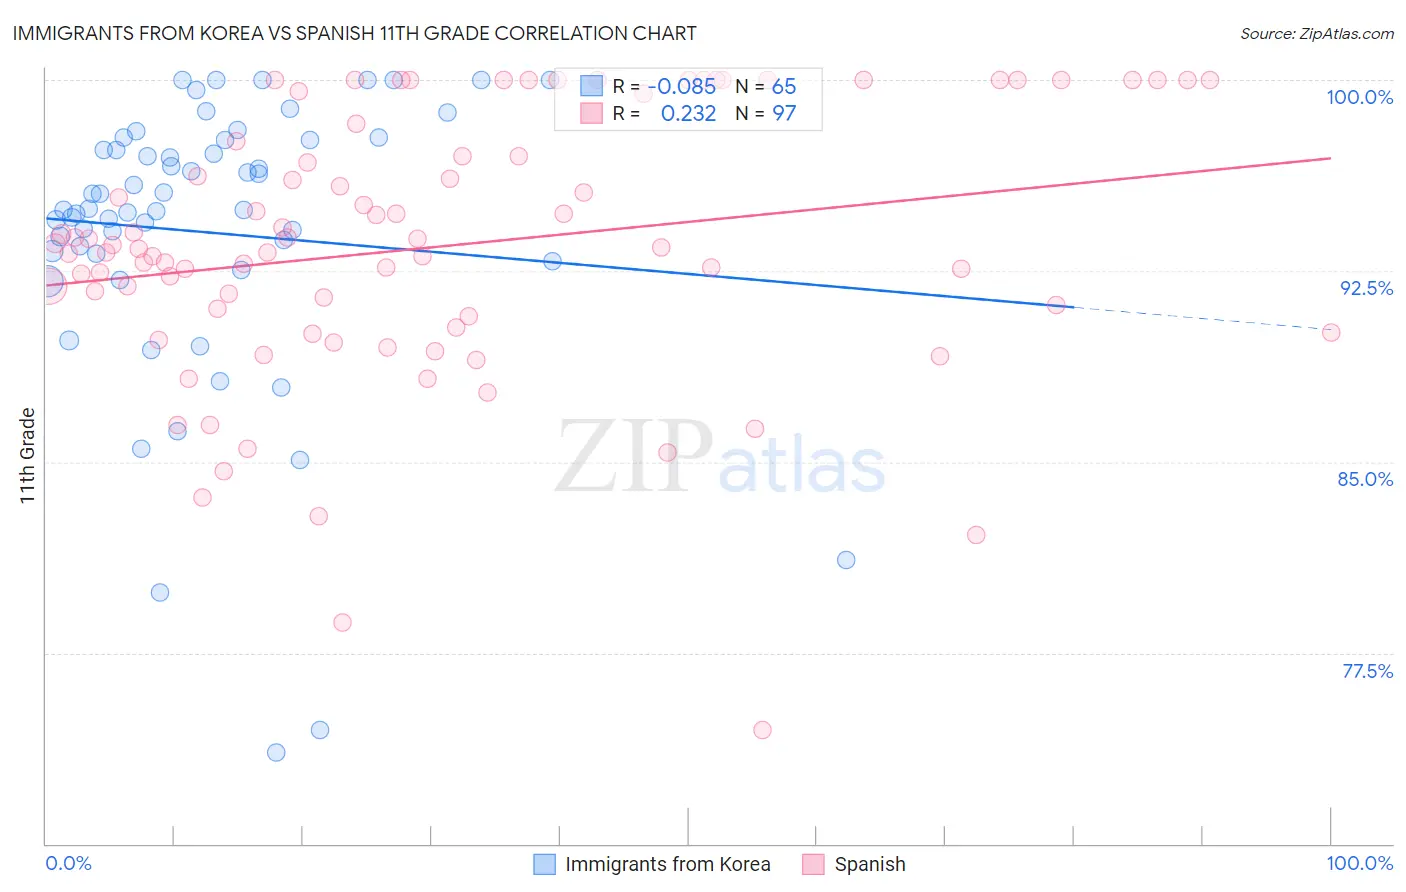
Immigrants from Korea vs Spanish 11th Grade Correlation Chart
The statistical analysis conducted on geographies consisting of 416,280,217 people shows a slight negative correlation between the proportion of Immigrants from Korea and percentage of population with at least 11th grade education in the United States with a correlation coefficient (R) of -0.085 and weighted average of 93.3%. Similarly, the statistical analysis conducted on geographies consisting of 422,188,828 people shows a weak positive correlation between the proportion of Spanish and percentage of population with at least 11th grade education in the United States with a correlation coefficient (R) of 0.232 and weighted average of 92.7%, a difference of 0.69%.
11th Grade Correlation Summary
| Measurement | Immigrants from Korea | Spanish |
| Minimum | 73.6% | 74.4% |
| Maximum | 100.0% | 100.0% |
| Range | 26.4% | 25.6% |
| Mean | 94.0% | 93.5% |
| Median | 94.9% | 93.4% |
| Interquartile 25% (IQ1) | 93.0% | 90.5% |
| Interquartile 75% (IQ3) | 97.6% | 97.9% |
| Interquartile Range (IQR) | 4.6% | 7.5% |
| Standard Deviation (Sample) | 5.7% | 5.3% |
| Standard Deviation (Population) | 5.6% | 5.2% |
Similar Demographics by 11th Grade
Demographics Similar to Immigrants from Korea by 11th Grade
In terms of 11th grade, the demographic groups most similar to Immigrants from Korea are Israeli (93.3%, a difference of 0.0%), Immigrants from Russia (93.3%, a difference of 0.030%), White/Caucasian (93.3%, a difference of 0.040%), Immigrants from Hungary (93.4%, a difference of 0.050%), and German Russian (93.3%, a difference of 0.050%).
| Demographics | Rating | Rank | 11th Grade |
| Yugoslavians | 98.1 /100 | #111 | Exceptional 93.4% |
| Immigrants | Germany | 98.0 /100 | #112 | Exceptional 93.4% |
| Immigrants | Zimbabwe | 97.8 /100 | #113 | Exceptional 93.4% |
| Jordanians | 97.8 /100 | #114 | Exceptional 93.4% |
| Palestinians | 97.7 /100 | #115 | Exceptional 93.4% |
| Immigrants | Hungary | 97.5 /100 | #116 | Exceptional 93.4% |
| Whites/Caucasians | 97.4 /100 | #117 | Exceptional 93.3% |
| Immigrants | Korea | 97.0 /100 | #118 | Exceptional 93.3% |
| Israelis | 97.0 /100 | #119 | Exceptional 93.3% |
| Immigrants | Russia | 96.6 /100 | #120 | Exceptional 93.3% |
| German Russians | 96.4 /100 | #121 | Exceptional 93.3% |
| Immigrants | Belarus | 96.3 /100 | #122 | Exceptional 93.3% |
| Immigrants | Greece | 95.9 /100 | #123 | Exceptional 93.2% |
| Immigrants | Eastern Europe | 95.9 /100 | #124 | Exceptional 93.2% |
| Immigrants | Sri Lanka | 95.6 /100 | #125 | Exceptional 93.2% |
Demographics Similar to Spanish by 11th Grade
In terms of 11th grade, the demographic groups most similar to Spanish are Nonimmigrants (92.7%, a difference of 0.0%), Paraguayan (92.7%, a difference of 0.030%), Immigrants from Iraq (92.6%, a difference of 0.030%), Immigrants from Argentina (92.7%, a difference of 0.040%), and Bermudan (92.6%, a difference of 0.040%).
| Demographics | Rating | Rank | 11th Grade |
| Immigrants | Eastern Asia | 72.6 /100 | #157 | Good 92.7% |
| Immigrants | Venezuela | 72.0 /100 | #158 | Good 92.7% |
| Americans | 71.7 /100 | #159 | Good 92.7% |
| Immigrants | Lebanon | 70.7 /100 | #160 | Good 92.7% |
| Immigrants | Argentina | 69.8 /100 | #161 | Good 92.7% |
| Paraguayans | 68.7 /100 | #162 | Good 92.7% |
| Immigrants | Nonimmigrants | 66.6 /100 | #163 | Good 92.7% |
| Spanish | 66.2 /100 | #164 | Good 92.7% |
| Immigrants | Iraq | 63.7 /100 | #165 | Good 92.6% |
| Bermudans | 62.3 /100 | #166 | Good 92.6% |
| Alsatians | 60.2 /100 | #167 | Good 92.6% |
| Sierra Leoneans | 58.7 /100 | #168 | Average 92.6% |
| Immigrants | Albania | 57.8 /100 | #169 | Average 92.6% |
| Immigrants | Northern Africa | 57.3 /100 | #170 | Average 92.6% |
| Laotians | 54.4 /100 | #171 | Average 92.6% |