Immigrants from Eastern Europe vs Spanish Currently Married

COMPARE

Immigrants from Eastern Europe
Race
Ancestry
AfghanAfricanAlaska NativeAlaskan AthabascanAlbanianAleutAlsatianAmericanApacheArabArapahoArgentineanArmenianAssyrian/Chaldean/SyriacAustralianAustrianBahamianBangladeshiBarbadianBasqueBelgianBelizeanBermudanBhutaneseBlackfeetBolivianBrazilianBritishBritish West IndianBulgarianBurmeseCajunCambodianCanadianCape VerdeanCarpatho RusynCelticCentral AmericanCentral American IndianCherokeeCheyenneChickasawChileanChineseChippewaChoctawColombianColvilleComancheCosta RicanCreeCreekCroatianCrowCubanCypriotCzechCzechoslovakianDanishDelawareDominicanDutchDutch West IndianEastern EuropeanEcuadorianEgyptianEnglishEstonianEthiopianEuropeanFijianFilipinoFinnishFrenchFrench American IndianFrench CanadianGermanGerman RussianGhanaianGreekGuamanian/ChamorroGuatemalanGuyaneseHaitianHmongHonduranHopiHoumaHungarianIcelanderIndian (Asian)IndonesianInupiatIranianIraqiIrishIroquoisIsraeliItalianJamaicanJapaneseJordanianKenyanKiowaKoreanLaotianLatvianLebaneseLiberianLithuanianLumbeeLuxembourgerMacedonianMalaysianMalteseMarshalleseMenomineeMexicanMexican American IndianMongolianMoroccanNative HawaiianNavajoNepaleseNew ZealanderNicaraguanNigerianNorthern EuropeanNorwegianOkinawanOsageOttawaPaiutePakistaniPalestinianPanamanianParaguayanPennsylvania GermanPeruvianPimaPolishPortuguesePotawatomiPuebloPuerto RicanPuget Sound SalishRomanianRussianSalvadoranSamoanScandinavianScotch-IrishScottishSeminoleSenegaleseSerbianShoshoneSierra LeoneanSiouxSlavicSlovakSloveneSomaliSouth AfricanSouth AmericanSouth American IndianSoviet UnionSpaniardSpanish AmericanSpanish American IndianSri LankanSubsaharan AfricanSudaneseSwedishSwissSyrianTaiwaneseThaiTlingit-HaidaTohono O'OdhamTonganTrinidadian and TobagonianTsimshianTurkishU.S. Virgin IslanderUgandanUkrainianUruguayanUteVenezuelanVietnameseWelshWest IndianYakamaYaquiYugoslavianYumanYup'ikZimbabwean
Immigration
NonimmigrantsImmigrantsAfghanistanAfricaAlbaniaArgentinaArmeniaAsiaAustraliaAustriaBahamasBangladeshBarbadosBelarusBelgiumBelizeBoliviaBosnia and HerzegovinaBrazilBulgariaBurma/MyanmarCabo VerdeCambodiaCameroonCanadaCaribbeanCentral AmericaChileChinaColombiaCongoCosta RicaCroatiaCubaCzechoslovakiaDenmarkDominicaDominican RepublicEastern AfricaEastern AsiaEastern EuropeEcuadorEgyptEl SalvadorEnglandEritreaEthiopiaEuropeFijiFranceGermanyGhanaGreeceGrenadaGuatemalaGuyanaHaitiHondurasHong KongHungaryIndiaIndonesiaIranIraqIrelandIsraelItalyJamaicaJapanJordanKazakhstanKenyaKoreaKuwaitLaosLatin AmericaLatviaLebanonLiberiaLithuaniaMalaysiaMexicoMicronesiaMiddle AfricaMoldovaMoroccoNepalNetherlandsNicaraguaNigeriaNorth AmericaNorth MacedoniaNorthern AfricaNorthern EuropeNorwayOceaniaPakistanPanamaPeruPhilippinesPolandPortugalRomaniaRussiaSaudi ArabiaScotlandSenegalSerbiaSierra LeoneSingaporeSomaliaSouth AfricaSouth AmericaSouth Central AsiaSouth Eastern AsiaSouthern EuropeSpainSri LankaSt. Vincent and the GrenadinesSudanSwedenSwitzerlandSyriaTaiwanThailandTrinidad and TobagoTurkeyUgandaUkraineUruguayUzbekistanVenezuelaVietnamWest IndiesWestern AfricaWestern AsiaWestern EuropeYemenZaireZimbabweAzores
Spanish
Race
Ancestry
AfghanAfricanAlaska NativeAlaskan AthabascanAlbanianAleutAlsatianAmericanApacheArabArapahoArgentineanArmenianAssyrian/Chaldean/SyriacAustralianAustrianBahamianBangladeshiBarbadianBasqueBelgianBelizeanBermudanBhutaneseBlackfeetBolivianBrazilianBritishBritish West IndianBulgarianBurmeseCajunCambodianCanadianCape VerdeanCarpatho RusynCelticCentral AmericanCentral American IndianCherokeeCheyenneChickasawChileanChineseChippewaChoctawColombianColvilleComancheCosta RicanCreeCreekCroatianCrowCubanCypriotCzechCzechoslovakianDanishDelawareDominicanDutchDutch West IndianEastern EuropeanEcuadorianEgyptianEnglishEstonianEthiopianEuropeanFijianFilipinoFinnishFrenchFrench American IndianFrench CanadianGermanGerman RussianGhanaianGreekGuamanian/ChamorroGuatemalanGuyaneseHaitianHmongHonduranHopiHoumaHungarianIcelanderIndian (Asian)IndonesianInupiatIranianIraqiIrishIroquoisIsraeliItalianJamaicanJapaneseJordanianKenyanKiowaKoreanLaotianLatvianLebaneseLiberianLithuanianLumbeeLuxembourgerMacedonianMalaysianMalteseMarshalleseMenomineeMexicanMexican American IndianMongolianMoroccanNative HawaiianNavajoNepaleseNew ZealanderNicaraguanNigerianNorthern EuropeanNorwegianOkinawanOsageOttawaPaiutePakistaniPalestinianPanamanianParaguayanPennsylvania GermanPeruvianPimaPolishPortuguesePotawatomiPuebloPuerto RicanPuget Sound SalishRomanianRussianSalvadoranSamoanScandinavianScotch-IrishScottishSeminoleSenegaleseSerbianShoshoneSierra LeoneanSiouxSlavicSlovakSloveneSomaliSouth AfricanSouth AmericanSouth American IndianSoviet UnionSpaniardSpanishSpanish AmericanSpanish American IndianSri LankanSubsaharan AfricanSudaneseSwedishSwissSyrianTaiwaneseThaiTlingit-HaidaTohono O'OdhamTonganTrinidadian and TobagonianTsimshianTurkishU.S. Virgin IslanderUgandanUkrainianUruguayanUteVenezuelanVietnameseWelshWest IndianYakamaYaquiYugoslavianYumanYup'ikZimbabwean
Immigration
NonimmigrantsImmigrantsAfghanistanAfricaAlbaniaArgentinaArmeniaAsiaAustraliaAustriaBahamasBangladeshBarbadosBelarusBelgiumBelizeBoliviaBosnia and HerzegovinaBrazilBulgariaBurma/MyanmarCabo VerdeCambodiaCameroonCanadaCaribbeanCentral AmericaChileChinaColombiaCongoCosta RicaCroatiaCubaCzechoslovakiaDenmarkDominicaDominican RepublicEastern AfricaEastern AsiaEcuadorEgyptEl SalvadorEnglandEritreaEthiopiaEuropeFijiFranceGermanyGhanaGreeceGrenadaGuatemalaGuyanaHaitiHondurasHong KongHungaryIndiaIndonesiaIranIraqIrelandIsraelItalyJamaicaJapanJordanKazakhstanKenyaKoreaKuwaitLaosLatin AmericaLatviaLebanonLiberiaLithuaniaMalaysiaMexicoMicronesiaMiddle AfricaMoldovaMoroccoNepalNetherlandsNicaraguaNigeriaNorth AmericaNorth MacedoniaNorthern AfricaNorthern EuropeNorwayOceaniaPakistanPanamaPeruPhilippinesPolandPortugalRomaniaRussiaSaudi ArabiaScotlandSenegalSerbiaSierra LeoneSingaporeSomaliaSouth AfricaSouth AmericaSouth Central AsiaSouth Eastern AsiaSouthern EuropeSpainSri LankaSt. Vincent and the GrenadinesSudanSwedenSwitzerlandSyriaTaiwanThailandTrinidad and TobagoTurkeyUgandaUkraineUruguayUzbekistanVenezuelaVietnamWest IndiesWestern AfricaWestern AsiaWestern EuropeYemenZaireZimbabweAzores
Currently Married
Income
Poverty
Unemployment
Labor Participation
Family Structure
Vehicle Availability
Education Level
Disability

Currently Married Comparison

Immigrants from Eastern Europe

Spanish

Exceptional
Good
48.0%
CURRENTLY MARRIED
96.1/ 100
METRIC RATING
88th/ 347
METRIC RANK
47.0%
CURRENTLY MARRIED
68.1/ 100
METRIC RATING
156th/ 347
METRIC RANK

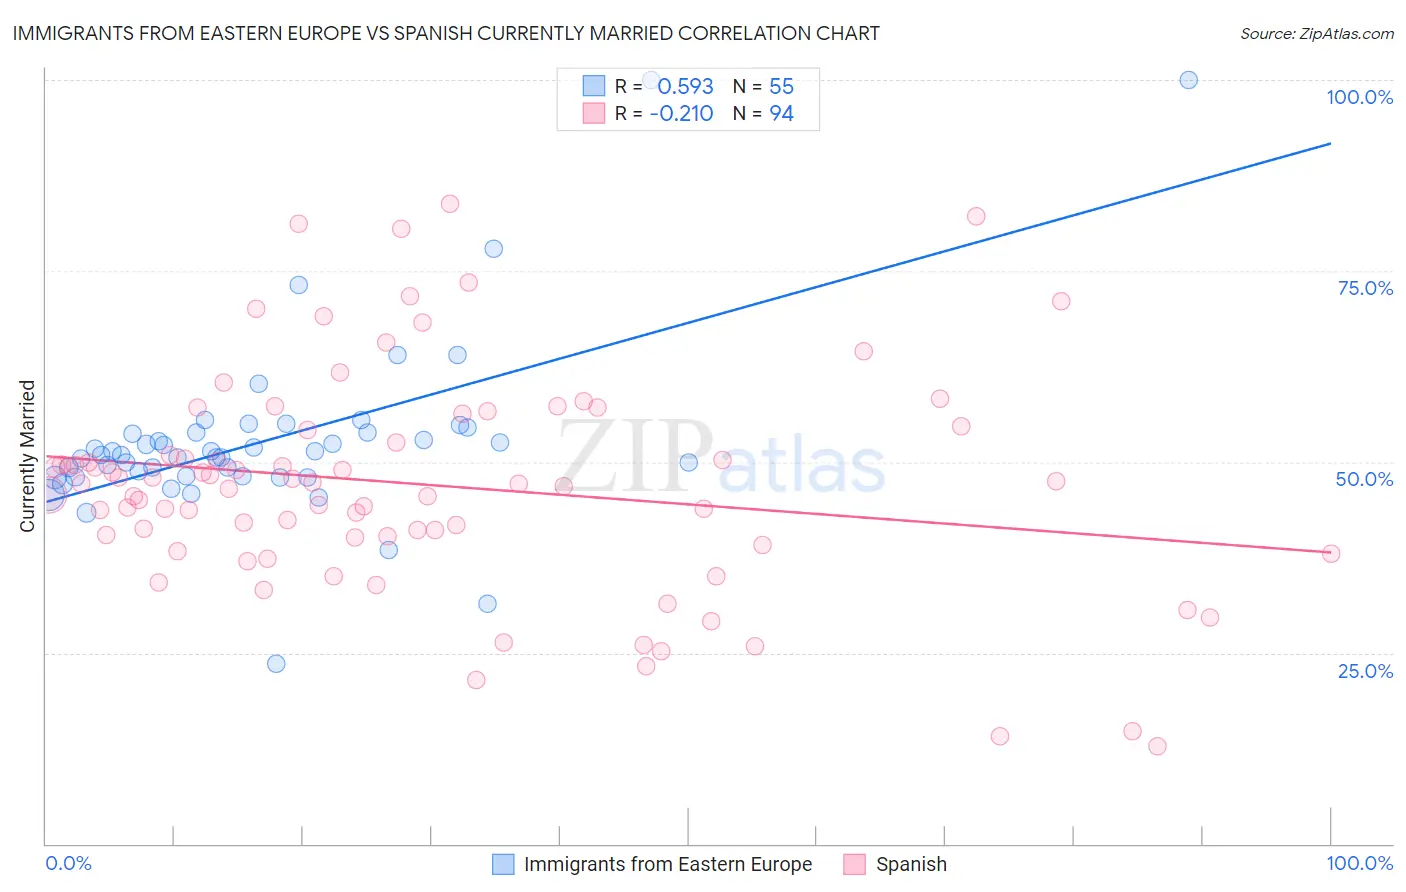
Immigrants from Eastern Europe vs Spanish Currently Married Correlation Chart

The statistical analysis conducted on geographies consisting of 475,818,716 people shows a substantial positive correlation between the proportion of Immigrants from Eastern Europe and percentage of population currently married in the United States with a correlation coefficient (R) of 0.593 and weighted average of 48.0%. Similarly, the statistical analysis conducted on geographies consisting of 422,154,276 people shows a weak negative correlation between the proportion of Spanish and percentage of population currently married in the United States with a correlation coefficient (R) of -0.210 and weighted average of 47.0%, a difference of 2.2%.
Immigrants from Eastern Europe vs Spanish Currently Married

Currently Married Correlation Summary

MeasurementImmigrants from Eastern EuropeSpanish
Minimum23.5%12.8%
Maximum100.0%83.7%
Range76.5%70.9%
Mean52.9%47.0%
Median50.9%47.2%
Interquartile 25% (IQ1)48.1%40.1%
Interquartile 75% (IQ3)53.9%54.2%
Interquartile Range (IQR)5.9%14.1%
Standard Deviation (Sample)12.1%14.5%
Standard Deviation (Population)12.0%14.4%

Similar Demographics by Currently Married

Demographics Similar to Immigrants from Eastern Europe by Currently Married

In terms of currently married, the demographic groups most similar to Immigrants from Eastern Europe are Jordanian (48.0%, a difference of 0.020%), Immigrants from Japan (48.0%, a difference of 0.030%), French Canadian (48.0%, a difference of 0.060%), Indian (Asian) (48.0%, a difference of 0.060%), and American (48.0%, a difference of 0.080%).
DemographicsRating | RankCurrently Married
Immigrants | Sri Lanka
96.9
/100
|
#81
Exceptional
48.1%
Immigrants | Europe
96.9
/100
|
#82
Exceptional
48.1%
Bolivians
96.9
/100
|
#83
Exceptional
48.1%
Immigrants | Israel
96.9
/100
|
#84
Exceptional
48.1%
French Canadians
96.3
/100
|
#85
Exceptional
48.0%
Immigrants | Japan
96.2
/100
|
#86
Exceptional
48.0%
Jordanians
96.2
/100
|
#87
Exceptional
48.0%
Immigrants | Eastern Europe
96.1
/100
|
#88
Exceptional
48.0%
Indians (Asian)
95.8
/100
|
#89
Exceptional
48.0%
Americans
95.7
/100
|
#90
Exceptional
48.0%
Immigrants | Bolivia
95.6
/100
|
#91
Exceptional
47.9%
Koreans
95.4
/100
|
#92
Exceptional
47.9%
Lebanese
95.1
/100
|
#93
Exceptional
47.9%
Native Hawaiians
95.0
/100
|
#94
Exceptional
47.9%
Immigrants | Bulgaria
94.8
/100
|
#95
Exceptional
47.9%

Demographics Similar to Spanish by Currently Married

In terms of currently married, the demographic groups most similar to Spanish are Immigrants from Switzerland (46.9%, a difference of 0.010%), Immigrants from Venezuela (47.0%, a difference of 0.020%), Albanian (47.0%, a difference of 0.020%), Arab (47.0%, a difference of 0.020%), and Immigrants from Serbia (47.0%, a difference of 0.030%).
DemographicsRating | RankCurrently Married
Zimbabweans
70.1
/100
|
#149
Good
47.0%
Immigrants | Turkey
70.0
/100
|
#150
Good
47.0%
Chileans
69.8
/100
|
#151
Good
47.0%
Immigrants | Serbia
68.8
/100
|
#152
Good
47.0%
Immigrants | Venezuela
68.6
/100
|
#153
Good
47.0%
Albanians
68.6
/100
|
#154
Good
47.0%
Arabs
68.6
/100
|
#155
Good
47.0%
Spanish
68.1
/100
|
#156
Good
47.0%
Immigrants | Switzerland
67.8
/100
|
#157
Good
46.9%
Cherokee
66.8
/100
|
#158
Good
46.9%
Iraqis
66.4
/100
|
#159
Good
46.9%
Immigrants | Uzbekistan
66.0
/100
|
#160
Good
46.9%
Immigrants | Southern Europe
65.9
/100
|
#161
Good
46.9%
Immigrants | Nonimmigrants
65.4
/100
|
#162
Good
46.9%
Delaware
64.7
/100
|
#163
Good
46.9%