Immigrants from Japan vs Immigrants from Belize Married-couple Households
COMPARE
Immigrants from Japan
Immigrants from Belize
Married-couple Households
Married-couple Households Comparison
Immigrants from Japan
Immigrants from Belize
47.7%
MARRIED-COUPLE HOUSEHOLDS
94.4/ 100
METRIC RATING
108th/ 347
METRIC RANK
41.8%
MARRIED-COUPLE HOUSEHOLDS
0.0/ 100
METRIC RATING
300th/ 347
METRIC RANK
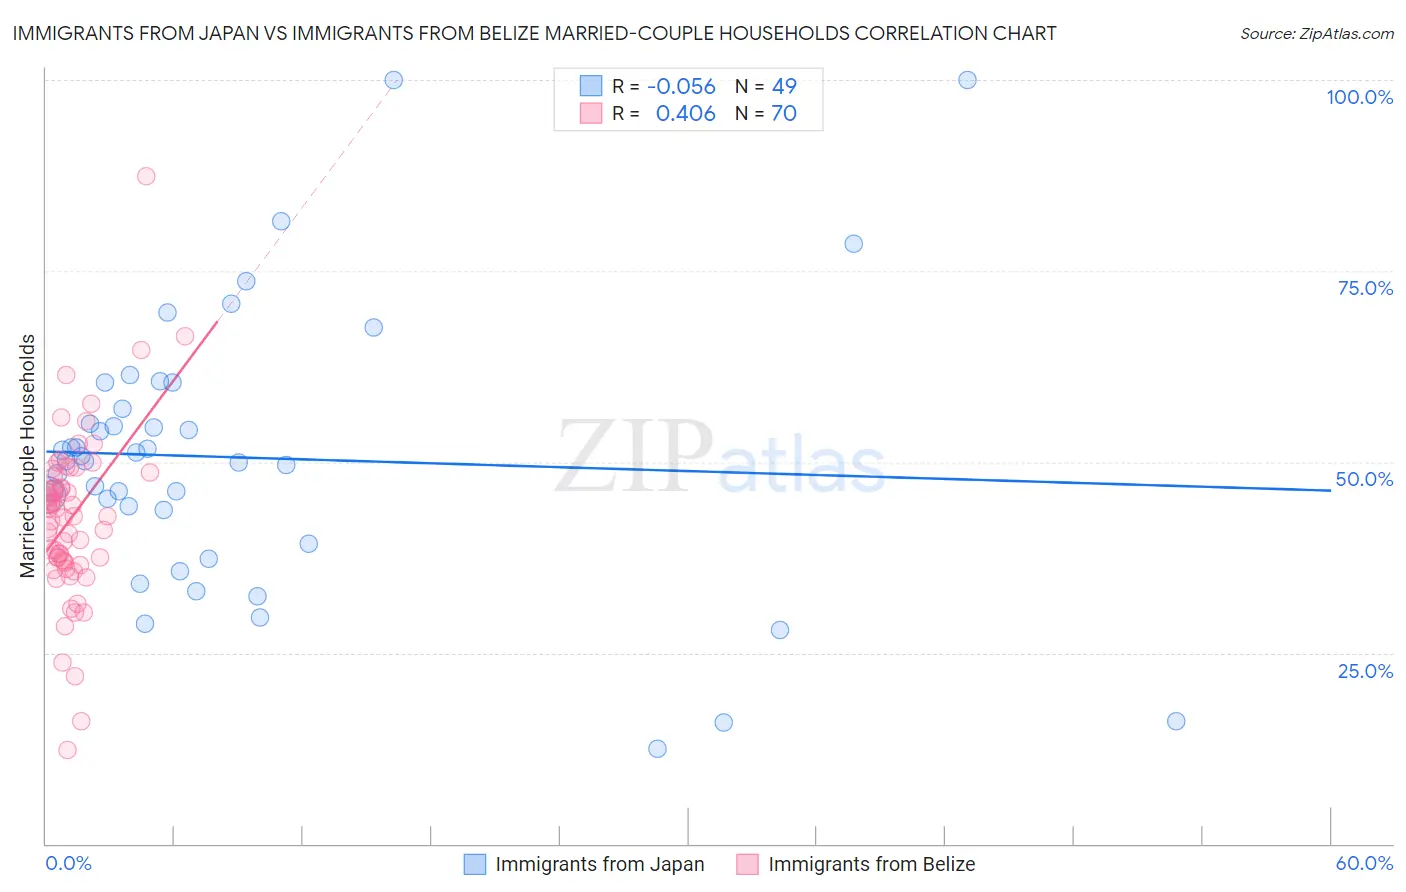
Immigrants from Japan vs Immigrants from Belize Married-couple Households Correlation Chart
The statistical analysis conducted on geographies consisting of 339,976,257 people shows a slight negative correlation between the proportion of Immigrants from Japan and percentage of married-couple family households in the United States with a correlation coefficient (R) of -0.056 and weighted average of 47.7%. Similarly, the statistical analysis conducted on geographies consisting of 130,286,340 people shows a moderate positive correlation between the proportion of Immigrants from Belize and percentage of married-couple family households in the United States with a correlation coefficient (R) of 0.406 and weighted average of 41.8%, a difference of 14.1%.
Married-couple Households Correlation Summary
| Measurement | Immigrants from Japan | Immigrants from Belize |
| Minimum | 12.5% | 12.3% |
| Maximum | 100.0% | 87.4% |
| Range | 87.5% | 75.1% |
| Mean | 50.6% | 42.7% |
| Median | 50.2% | 42.9% |
| Interquartile 25% (IQ1) | 41.5% | 37.0% |
| Interquartile 75% (IQ3) | 58.7% | 48.1% |
| Interquartile Range (IQR) | 17.2% | 11.1% |
| Standard Deviation (Sample) | 18.1% | 11.1% |
| Standard Deviation (Population) | 17.9% | 11.0% |
Similar Demographics by Married-couple Households
Demographics Similar to Immigrants from Japan by Married-couple Households
In terms of married-couple households, the demographic groups most similar to Immigrants from Japan are Estonian (47.7%, a difference of 0.050%), Immigrants from Jordan (47.7%, a difference of 0.050%), Macedonian (47.6%, a difference of 0.070%), Syrian (47.6%, a difference of 0.080%), and Peruvian (47.6%, a difference of 0.090%).
| Demographics | Rating | Rank | Married-couple Households |
| Turks | 96.1 /100 | #101 | Exceptional 47.8% |
| Slavs | 96.0 /100 | #102 | Exceptional 47.8% |
| Hawaiians | 96.0 /100 | #103 | Exceptional 47.8% |
| Immigrants | South Africa | 96.0 /100 | #104 | Exceptional 47.8% |
| Immigrants | Czechoslovakia | 95.5 /100 | #105 | Exceptional 47.8% |
| Portuguese | 95.5 /100 | #106 | Exceptional 47.8% |
| Estonians | 94.7 /100 | #107 | Exceptional 47.7% |
| Immigrants | Japan | 94.4 /100 | #108 | Exceptional 47.7% |
| Immigrants | Jordan | 94.1 /100 | #109 | Exceptional 47.7% |
| Macedonians | 93.9 /100 | #110 | Exceptional 47.6% |
| Syrians | 93.9 /100 | #111 | Exceptional 47.6% |
| Peruvians | 93.8 /100 | #112 | Exceptional 47.6% |
| Venezuelans | 93.8 /100 | #113 | Exceptional 47.6% |
| Immigrants | Europe | 93.7 /100 | #114 | Exceptional 47.6% |
| Slovaks | 92.9 /100 | #115 | Exceptional 47.6% |
Demographics Similar to Immigrants from Belize by Married-couple Households
In terms of married-couple households, the demographic groups most similar to Immigrants from Belize are Immigrants from Ghana (41.8%, a difference of 0.020%), Immigrants from Middle Africa (41.8%, a difference of 0.090%), Arapaho (41.8%, a difference of 0.13%), Immigrants from Bahamas (41.7%, a difference of 0.21%), and Immigrants from Honduras (41.6%, a difference of 0.38%).
| Demographics | Rating | Rank | Married-couple Households |
| Menominee | 0.0 /100 | #293 | Tragic 42.0% |
| Immigrants | Yemen | 0.0 /100 | #294 | Tragic 42.0% |
| Kiowa | 0.0 /100 | #295 | Tragic 42.0% |
| Immigrants | Sudan | 0.0 /100 | #296 | Tragic 41.9% |
| Arapaho | 0.0 /100 | #297 | Tragic 41.8% |
| Immigrants | Middle Africa | 0.0 /100 | #298 | Tragic 41.8% |
| Immigrants | Ghana | 0.0 /100 | #299 | Tragic 41.8% |
| Immigrants | Belize | 0.0 /100 | #300 | Tragic 41.8% |
| Immigrants | Bahamas | 0.0 /100 | #301 | Tragic 41.7% |
| Immigrants | Honduras | 0.0 /100 | #302 | Tragic 41.6% |
| Sub-Saharan Africans | 0.0 /100 | #303 | Tragic 41.6% |
| Immigrants | Guyana | 0.0 /100 | #304 | Tragic 41.6% |
| Sioux | 0.0 /100 | #305 | Tragic 41.5% |
| Guyanese | 0.0 /100 | #306 | Tragic 41.4% |
| Immigrants | Western Africa | 0.0 /100 | #307 | Tragic 41.4% |