Immigrants from Israel vs Paiute Family Households with Children
COMPARE
Immigrants from Israel
Paiute
Family Households with Children
Family Households with Children Comparison
Immigrants from Israel
Paiute
27.4%
FAMILY HOUSEHOLDS WITH CHILDREN
37.9/ 100
METRIC RATING
189th/ 347
METRIC RANK
26.4%
FAMILY HOUSEHOLDS WITH CHILDREN
0.1/ 100
METRIC RATING
300th/ 347
METRIC RANK
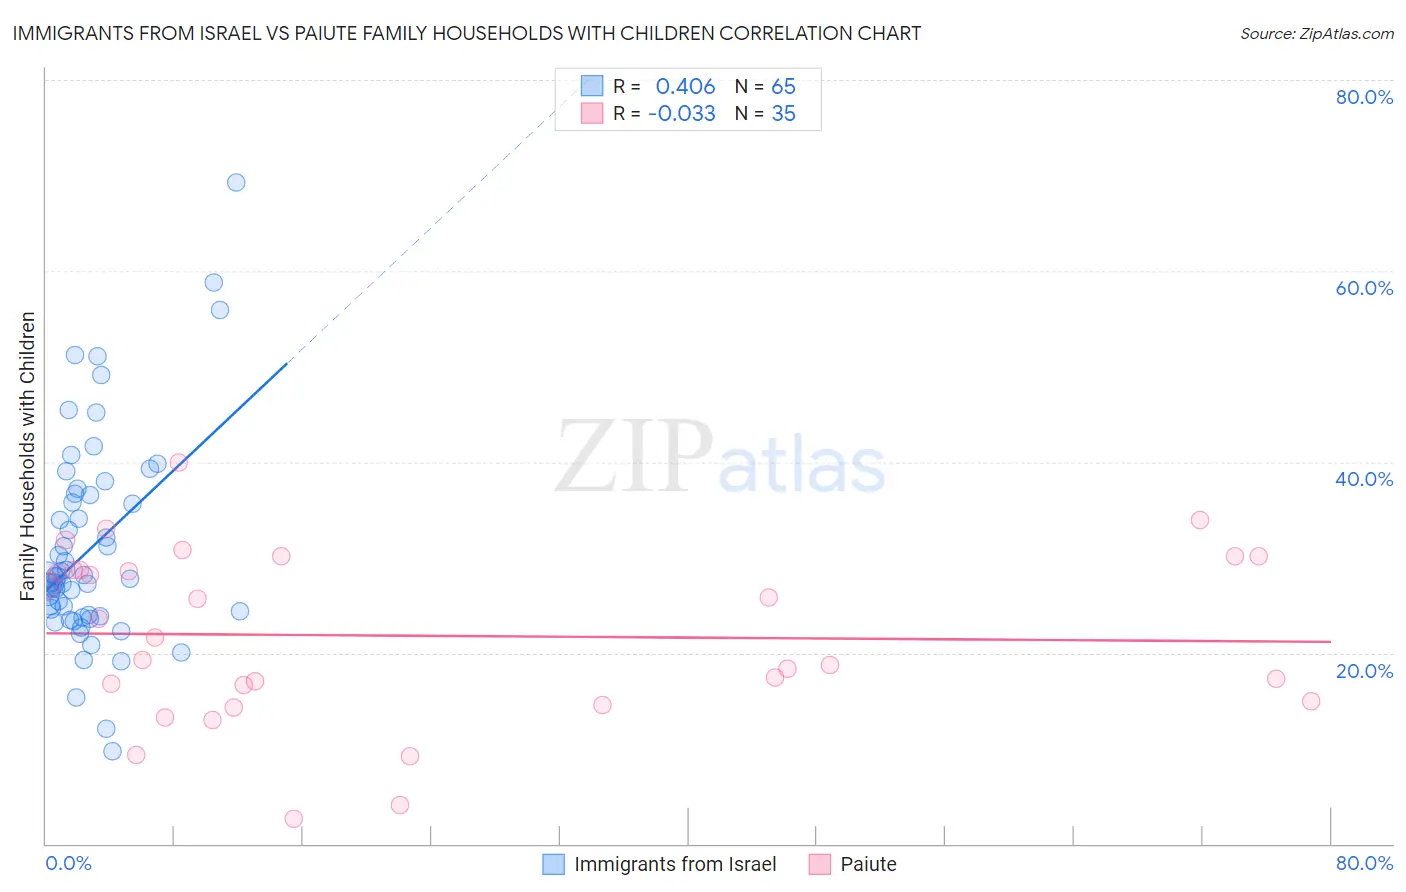
Immigrants from Israel vs Paiute Family Households with Children Correlation Chart
The statistical analysis conducted on geographies consisting of 209,857,521 people shows a moderate positive correlation between the proportion of Immigrants from Israel and percentage of family households with children in the United States with a correlation coefficient (R) of 0.406 and weighted average of 27.4%. Similarly, the statistical analysis conducted on geographies consisting of 58,389,869 people shows no correlation between the proportion of Paiute and percentage of family households with children in the United States with a correlation coefficient (R) of -0.033 and weighted average of 26.4%, a difference of 3.8%.
Family Households with Children Correlation Summary
| Measurement | Immigrants from Israel | Paiute |
| Minimum | 9.6% | 2.7% |
| Maximum | 69.2% | 40.0% |
| Range | 59.6% | 37.3% |
| Mean | 31.0% | 21.8% |
| Median | 27.7% | 21.6% |
| Interquartile 25% (IQ1) | 23.9% | 15.0% |
| Interquartile 75% (IQ3) | 36.6% | 28.7% |
| Interquartile Range (IQR) | 12.7% | 13.8% |
| Standard Deviation (Sample) | 10.9% | 8.9% |
| Standard Deviation (Population) | 10.8% | 8.8% |
Similar Demographics by Family Households with Children
Demographics Similar to Immigrants from Israel by Family Households with Children
In terms of family households with children, the demographic groups most similar to Immigrants from Israel are Immigrants from Uruguay (27.4%, a difference of 0.010%), Sudanese (27.4%, a difference of 0.010%), Pennsylvania German (27.4%, a difference of 0.010%), Dutch (27.4%, a difference of 0.020%), and Swedish (27.4%, a difference of 0.020%).
| Demographics | Rating | Rank | Family Households with Children |
| Puget Sound Salish | 46.2 /100 | #182 | Average 27.4% |
| South Africans | 44.9 /100 | #183 | Average 27.4% |
| Native Hawaiians | 44.6 /100 | #184 | Average 27.4% |
| Delaware | 42.0 /100 | #185 | Average 27.4% |
| Immigrants | Brazil | 40.6 /100 | #186 | Average 27.4% |
| Creek | 39.8 /100 | #187 | Fair 27.4% |
| Dutch | 38.8 /100 | #188 | Fair 27.4% |
| Immigrants | Israel | 37.9 /100 | #189 | Fair 27.4% |
| Immigrants | Uruguay | 37.7 /100 | #190 | Fair 27.4% |
| Sudanese | 37.6 /100 | #191 | Fair 27.4% |
| Pennsylvania Germans | 37.5 /100 | #192 | Fair 27.4% |
| Swedes | 36.9 /100 | #193 | Fair 27.4% |
| Immigrants | Iran | 36.1 /100 | #194 | Fair 27.4% |
| Crow | 35.7 /100 | #195 | Fair 27.4% |
| Cheyenne | 35.1 /100 | #196 | Fair 27.4% |
Demographics Similar to Paiute by Family Households with Children
In terms of family households with children, the demographic groups most similar to Paiute are Immigrants from Trinidad and Tobago (26.4%, a difference of 0.020%), Serbian (26.4%, a difference of 0.030%), Immigrants from Guyana (26.3%, a difference of 0.060%), Immigrants from Bahamas (26.3%, a difference of 0.11%), and Trinidadian and Tobagonian (26.4%, a difference of 0.12%).
| Demographics | Rating | Rank | Family Households with Children |
| Blacks/African Americans | 0.1 /100 | #293 | Tragic 26.5% |
| Latvians | 0.1 /100 | #294 | Tragic 26.4% |
| Macedonians | 0.1 /100 | #295 | Tragic 26.4% |
| Croatians | 0.1 /100 | #296 | Tragic 26.4% |
| Armenians | 0.1 /100 | #297 | Tragic 26.4% |
| Immigrants | Western Europe | 0.1 /100 | #298 | Tragic 26.4% |
| Trinidadians and Tobagonians | 0.1 /100 | #299 | Tragic 26.4% |
| Paiute | 0.1 /100 | #300 | Tragic 26.4% |
| Immigrants | Trinidad and Tobago | 0.1 /100 | #301 | Tragic 26.4% |
| Serbians | 0.1 /100 | #302 | Tragic 26.4% |
| Immigrants | Guyana | 0.1 /100 | #303 | Tragic 26.3% |
| Immigrants | Bahamas | 0.1 /100 | #304 | Tragic 26.3% |
| Guyanese | 0.1 /100 | #305 | Tragic 26.3% |
| Bermudans | 0.1 /100 | #306 | Tragic 26.3% |
| West Indians | 0.0 /100 | #307 | Tragic 26.3% |