Scottish vs Paiute Family Households with Children
COMPARE
Scottish
Paiute
Family Households with Children
Family Households with Children Comparison
Scottish
Paiute
27.0%
FAMILY HOUSEHOLDS WITH CHILDREN
6.5/ 100
METRIC RATING
228th/ 347
METRIC RANK
26.4%
FAMILY HOUSEHOLDS WITH CHILDREN
0.1/ 100
METRIC RATING
300th/ 347
METRIC RANK
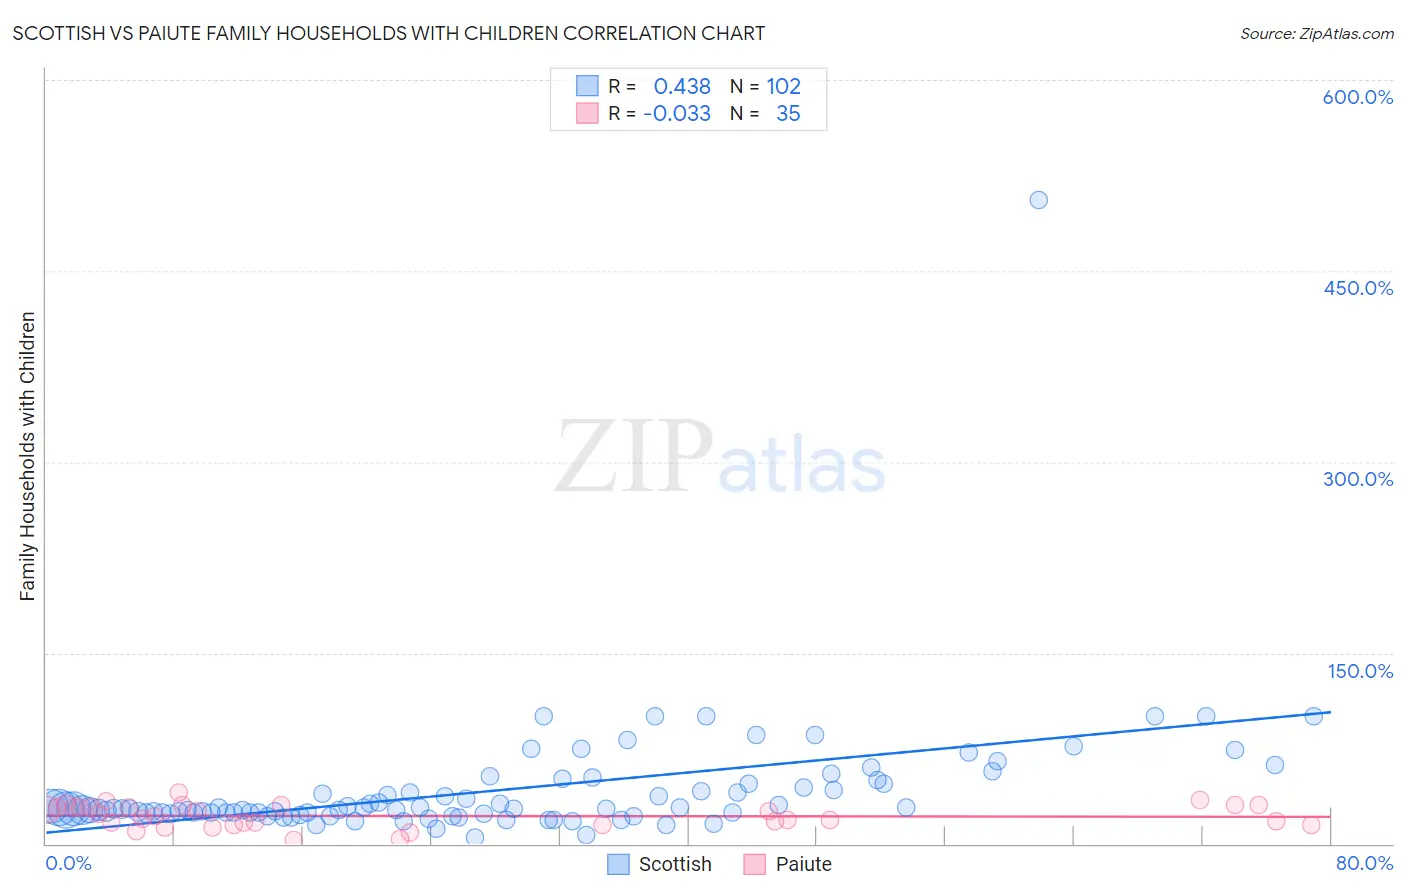
Scottish vs Paiute Family Households with Children Correlation Chart
The statistical analysis conducted on geographies consisting of 566,154,348 people shows a moderate positive correlation between the proportion of Scottish and percentage of family households with children in the United States with a correlation coefficient (R) of 0.438 and weighted average of 27.0%. Similarly, the statistical analysis conducted on geographies consisting of 58,389,869 people shows no correlation between the proportion of Paiute and percentage of family households with children in the United States with a correlation coefficient (R) of -0.033 and weighted average of 26.4%, a difference of 2.6%.
Family Households with Children Correlation Summary
| Measurement | Scottish | Paiute |
| Minimum | 5.1% | 2.7% |
| Maximum | 505.5% | 40.0% |
| Range | 500.4% | 37.3% |
| Mean | 42.0% | 21.8% |
| Median | 27.3% | 21.6% |
| Interquartile 25% (IQ1) | 24.2% | 15.0% |
| Interquartile 75% (IQ3) | 47.1% | 28.7% |
| Interquartile Range (IQR) | 22.9% | 13.8% |
| Standard Deviation (Sample) | 51.9% | 8.9% |
| Standard Deviation (Population) | 51.6% | 8.8% |
Similar Demographics by Family Households with Children
Demographics Similar to Scottish by Family Households with Children
In terms of family households with children, the demographic groups most similar to Scottish are Czechoslovakian (27.0%, a difference of 0.0%), Tsimshian (27.0%, a difference of 0.0%), Immigrants from Caribbean (27.0%, a difference of 0.030%), Canadian (27.1%, a difference of 0.080%), and Bulgarian (27.0%, a difference of 0.080%).
| Demographics | Rating | Rank | Family Households with Children |
| New Zealanders | 9.6 /100 | #221 | Tragic 27.1% |
| Paraguayans | 9.4 /100 | #222 | Tragic 27.1% |
| Pima | 9.2 /100 | #223 | Tragic 27.1% |
| Germans | 8.7 /100 | #224 | Tragic 27.1% |
| Canadians | 7.5 /100 | #225 | Tragic 27.1% |
| Czechoslovakians | 6.6 /100 | #226 | Tragic 27.0% |
| Tsimshian | 6.6 /100 | #227 | Tragic 27.0% |
| Scottish | 6.5 /100 | #228 | Tragic 27.0% |
| Immigrants | Caribbean | 6.3 /100 | #229 | Tragic 27.0% |
| Bulgarians | 5.8 /100 | #230 | Tragic 27.0% |
| Luxembourgers | 5.5 /100 | #231 | Tragic 27.0% |
| Yugoslavians | 5.1 /100 | #232 | Tragic 27.0% |
| Immigrants | Italy | 5.0 /100 | #233 | Tragic 27.0% |
| Immigrants | Germany | 4.4 /100 | #234 | Tragic 27.0% |
| Immigrants | Morocco | 4.2 /100 | #235 | Tragic 27.0% |
Demographics Similar to Paiute by Family Households with Children
In terms of family households with children, the demographic groups most similar to Paiute are Immigrants from Trinidad and Tobago (26.4%, a difference of 0.020%), Serbian (26.4%, a difference of 0.030%), Immigrants from Guyana (26.3%, a difference of 0.060%), Immigrants from Bahamas (26.3%, a difference of 0.11%), and Trinidadian and Tobagonian (26.4%, a difference of 0.12%).
| Demographics | Rating | Rank | Family Households with Children |
| Blacks/African Americans | 0.1 /100 | #293 | Tragic 26.5% |
| Latvians | 0.1 /100 | #294 | Tragic 26.4% |
| Macedonians | 0.1 /100 | #295 | Tragic 26.4% |
| Croatians | 0.1 /100 | #296 | Tragic 26.4% |
| Armenians | 0.1 /100 | #297 | Tragic 26.4% |
| Immigrants | Western Europe | 0.1 /100 | #298 | Tragic 26.4% |
| Trinidadians and Tobagonians | 0.1 /100 | #299 | Tragic 26.4% |
| Paiute | 0.1 /100 | #300 | Tragic 26.4% |
| Immigrants | Trinidad and Tobago | 0.1 /100 | #301 | Tragic 26.4% |
| Serbians | 0.1 /100 | #302 | Tragic 26.4% |
| Immigrants | Guyana | 0.1 /100 | #303 | Tragic 26.3% |
| Immigrants | Bahamas | 0.1 /100 | #304 | Tragic 26.3% |
| Guyanese | 0.1 /100 | #305 | Tragic 26.3% |
| Bermudans | 0.1 /100 | #306 | Tragic 26.3% |
| West Indians | 0.0 /100 | #307 | Tragic 26.3% |