Immigrants from Israel vs Paiute 11th Grade

COMPARE

Immigrants from Israel
Race
Ancestry
AfghanAfricanAlaska NativeAlaskan AthabascanAlbanianAleutAlsatianAmericanApacheArabArapahoArgentineanArmenianAssyrian/Chaldean/SyriacAustralianAustrianBahamianBangladeshiBarbadianBasqueBelgianBelizeanBermudanBhutaneseBlackfeetBolivianBrazilianBritishBritish West IndianBulgarianBurmeseCajunCambodianCanadianCape VerdeanCarpatho RusynCelticCentral AmericanCentral American IndianCherokeeCheyenneChickasawChileanChineseChippewaChoctawColombianColvilleComancheCosta RicanCreeCreekCroatianCrowCubanCypriotCzechCzechoslovakianDanishDelawareDominicanDutchDutch West IndianEastern EuropeanEcuadorianEgyptianEnglishEstonianEthiopianEuropeanFijianFilipinoFinnishFrenchFrench American IndianFrench CanadianGermanGerman RussianGhanaianGreekGuamanian/ChamorroGuatemalanGuyaneseHaitianHmongHonduranHopiHoumaHungarianIcelanderIndian (Asian)IndonesianInupiatIranianIraqiIrishIroquoisIsraeliItalianJamaicanJapaneseJordanianKenyanKiowaKoreanLaotianLatvianLebaneseLiberianLithuanianLumbeeLuxembourgerMacedonianMalaysianMalteseMarshalleseMenomineeMexicanMexican American IndianMongolianMoroccanNative HawaiianNavajoNepaleseNew ZealanderNicaraguanNigerianNorthern EuropeanNorwegianOkinawanOsageOttawaPakistaniPalestinianPanamanianParaguayanPennsylvania GermanPeruvianPimaPolishPortuguesePotawatomiPuebloPuerto RicanPuget Sound SalishRomanianRussianSalvadoranSamoanScandinavianScotch-IrishScottishSeminoleSenegaleseSerbianShoshoneSierra LeoneanSiouxSlavicSlovakSloveneSomaliSouth AfricanSouth AmericanSouth American IndianSoviet UnionSpaniardSpanishSpanish AmericanSpanish American IndianSri LankanSubsaharan AfricanSudaneseSwedishSwissSyrianTaiwaneseThaiTlingit-HaidaTohono O'OdhamTonganTrinidadian and TobagonianTsimshianTurkishU.S. Virgin IslanderUgandanUkrainianUruguayanUteVenezuelanVietnameseWelshWest IndianYakamaYaquiYugoslavianYumanYup'ikZimbabwean
Immigration
NonimmigrantsImmigrantsAfghanistanAfricaAlbaniaArgentinaArmeniaAsiaAustraliaAustriaBahamasBangladeshBarbadosBelarusBelgiumBelizeBoliviaBosnia and HerzegovinaBrazilBulgariaBurma/MyanmarCabo VerdeCambodiaCameroonCanadaCaribbeanCentral AmericaChileChinaColombiaCongoCosta RicaCroatiaCubaCzechoslovakiaDenmarkDominicaDominican RepublicEastern AfricaEastern AsiaEastern EuropeEcuadorEgyptEl SalvadorEnglandEritreaEthiopiaEuropeFijiFranceGermanyGhanaGreeceGrenadaGuatemalaGuyanaHaitiHondurasHong KongHungaryIndiaIndonesiaIranIraqIrelandIsraelItalyJamaicaJapanJordanKazakhstanKenyaKoreaKuwaitLaosLatin AmericaLatviaLebanonLiberiaLithuaniaMalaysiaMexicoMicronesiaMiddle AfricaMoldovaMoroccoNepalNetherlandsNicaraguaNigeriaNorth AmericaNorth MacedoniaNorthern AfricaNorthern EuropeNorwayOceaniaPakistanPanamaPeruPhilippinesPolandPortugalRomaniaRussiaSaudi ArabiaScotlandSenegalSerbiaSierra LeoneSingaporeSomaliaSouth AfricaSouth AmericaSouth Central AsiaSouth Eastern AsiaSouthern EuropeSpainSri LankaSt. Vincent and the GrenadinesSudanSwedenSwitzerlandSyriaTaiwanThailandTrinidad and TobagoTurkeyUgandaUkraineUruguayUzbekistanVenezuelaVietnamWest IndiesWestern AfricaWestern AsiaWestern EuropeYemenZaireZimbabweAzores
Paiute
Race
Ancestry
AfghanAfricanAlaska NativeAlaskan AthabascanAlbanianAleutAlsatianAmericanApacheArabArapahoArgentineanArmenianAssyrian/Chaldean/SyriacAustralianAustrianBahamianBangladeshiBarbadianBasqueBelgianBelizeanBermudanBhutaneseBlackfeetBolivianBrazilianBritishBritish West IndianBulgarianBurmeseCajunCambodianCanadianCape VerdeanCarpatho RusynCelticCentral AmericanCentral American IndianCherokeeCheyenneChickasawChileanChineseChippewaChoctawColombianColvilleComancheCosta RicanCreeCreekCroatianCrowCubanCypriotCzechCzechoslovakianDanishDelawareDominicanDutchDutch West IndianEastern EuropeanEcuadorianEgyptianEnglishEstonianEthiopianEuropeanFijianFilipinoFinnishFrenchFrench American IndianFrench CanadianGermanGerman RussianGhanaianGreekGuamanian/ChamorroGuatemalanGuyaneseHaitianHmongHonduranHopiHoumaHungarianIcelanderIndian (Asian)IndonesianInupiatIranianIraqiIrishIroquoisIsraeliItalianJamaicanJapaneseJordanianKenyanKiowaKoreanLaotianLatvianLebaneseLiberianLithuanianLumbeeLuxembourgerMacedonianMalaysianMalteseMarshalleseMenomineeMexicanMexican American IndianMongolianMoroccanNative HawaiianNavajoNepaleseNew ZealanderNicaraguanNigerianNorthern EuropeanNorwegianOkinawanOsageOttawaPaiutePakistaniPalestinianPanamanianParaguayanPennsylvania GermanPeruvianPimaPolishPortuguesePotawatomiPuebloPuerto RicanPuget Sound SalishRomanianRussianSalvadoranSamoanScandinavianScotch-IrishScottishSeminoleSenegaleseSerbianShoshoneSierra LeoneanSiouxSlavicSlovakSloveneSomaliSouth AfricanSouth AmericanSouth American IndianSoviet UnionSpaniardSpanishSpanish AmericanSpanish American IndianSri LankanSubsaharan AfricanSudaneseSwedishSwissSyrianTaiwaneseThaiTlingit-HaidaTohono O'OdhamTonganTrinidadian and TobagonianTsimshianTurkishU.S. Virgin IslanderUgandanUkrainianUruguayanUteVenezuelanVietnameseWelshWest IndianYakamaYaquiYugoslavianYumanYup'ikZimbabwean
Immigration
NonimmigrantsImmigrantsAfghanistanAfricaAlbaniaArgentinaArmeniaAsiaAustraliaAustriaBahamasBangladeshBarbadosBelarusBelgiumBelizeBoliviaBosnia and HerzegovinaBrazilBulgariaBurma/MyanmarCabo VerdeCambodiaCameroonCanadaCaribbeanCentral AmericaChileChinaColombiaCongoCosta RicaCroatiaCubaCzechoslovakiaDenmarkDominicaDominican RepublicEastern AfricaEastern AsiaEastern EuropeEcuadorEgyptEl SalvadorEnglandEritreaEthiopiaEuropeFijiFranceGermanyGhanaGreeceGrenadaGuatemalaGuyanaHaitiHondurasHong KongHungaryIndiaIndonesiaIranIraqIrelandItalyJamaicaJapanJordanKazakhstanKenyaKoreaKuwaitLaosLatin AmericaLatviaLebanonLiberiaLithuaniaMalaysiaMexicoMicronesiaMiddle AfricaMoldovaMoroccoNepalNetherlandsNicaraguaNigeriaNorth AmericaNorth MacedoniaNorthern AfricaNorthern EuropeNorwayOceaniaPakistanPanamaPeruPhilippinesPolandPortugalRomaniaRussiaSaudi ArabiaScotlandSenegalSerbiaSierra LeoneSingaporeSomaliaSouth AfricaSouth AmericaSouth Central AsiaSouth Eastern AsiaSouthern EuropeSpainSri LankaSt. Vincent and the GrenadinesSudanSwedenSwitzerlandSyriaTaiwanThailandTrinidad and TobagoTurkeyUgandaUkraineUruguayUzbekistanVenezuelaVietnamWest IndiesWestern AfricaWestern AsiaWestern EuropeYemenZaireZimbabweAzores
11th Grade
Income
Poverty
Unemployment
Labor Participation
Family Structure
Vehicle Availability
Education Level
Disability

11th Grade Comparison

Immigrants from Israel

Paiute

Exceptional
Tragic
93.5%
11TH GRADE
98.8/ 100
METRIC RATING
98th/ 347
METRIC RANK
91.0%
11TH GRADE
0.1/ 100
METRIC RATING
273rd/ 347
METRIC RANK

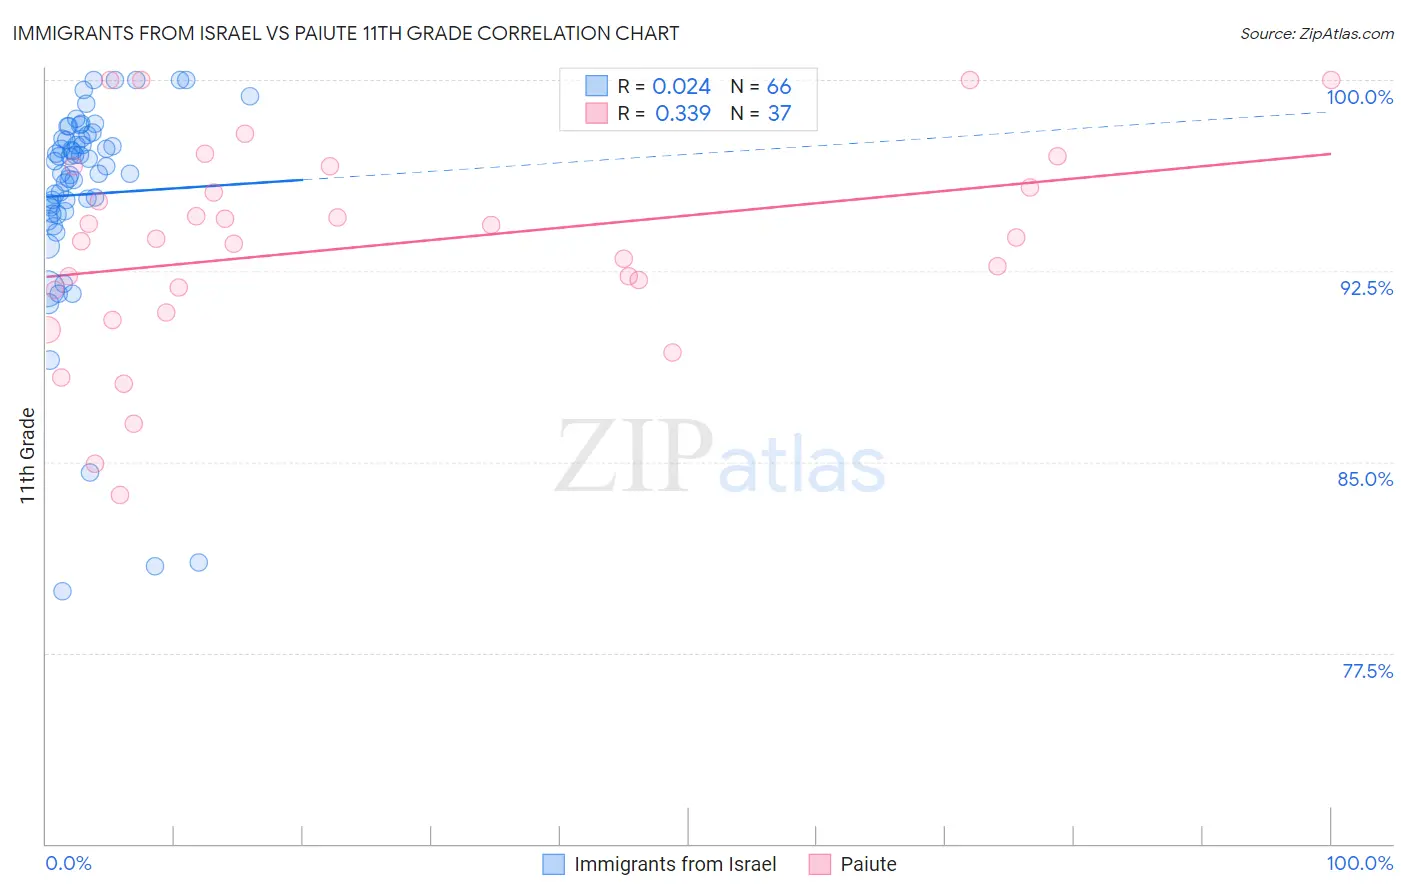
Immigrants from Israel vs Paiute 11th Grade Correlation Chart

The statistical analysis conducted on geographies consisting of 210,030,386 people shows no correlation between the proportion of Immigrants from Israel and percentage of population with at least 11th grade education in the United States with a correlation coefficient (R) of 0.024 and weighted average of 93.5%. Similarly, the statistical analysis conducted on geographies consisting of 58,403,520 people shows a mild positive correlation between the proportion of Paiute and percentage of population with at least 11th grade education in the United States with a correlation coefficient (R) of 0.339 and weighted average of 91.0%, a difference of 2.8%.
Immigrants from Israel vs Paiute 11th Grade

11th Grade Correlation Summary

MeasurementImmigrants from IsraelPaiute
Minimum79.9%83.7%
Maximum100.0%100.0%
Range20.1%16.3%
Mean95.5%93.4%
Median96.7%93.8%
Interquartile 25% (IQ1)94.8%91.3%
Interquartile 75% (IQ3)97.7%96.2%
Interquartile Range (IQR)2.9%4.9%
Standard Deviation (Sample)4.3%4.0%
Standard Deviation (Population)4.2%4.0%

Similar Demographics by 11th Grade

Demographics Similar to Immigrants from Israel by 11th Grade

In terms of 11th grade, the demographic groups most similar to Immigrants from Israel are Menominee (93.5%, a difference of 0.0%), Immigrants from North Macedonia (93.5%, a difference of 0.010%), Immigrants from Iran (93.5%, a difference of 0.020%), Immigrants from Romania (93.5%, a difference of 0.020%), and Immigrants from Turkey (93.5%, a difference of 0.030%).
DemographicsRating | Rank11th Grade
South Africans
99.2
/100
|
#91
Exceptional
93.6%
Immigrants | Bulgaria
99.1
/100
|
#92
Exceptional
93.6%
Puget Sound Salish
99.1
/100
|
#93
Exceptional
93.6%
Swiss
99.0
/100
|
#94
Exceptional
93.6%
Immigrants | France
99.0
/100
|
#95
Exceptional
93.6%
Immigrants | Turkey
98.9
/100
|
#96
Exceptional
93.5%
Immigrants | Iran
98.9
/100
|
#97
Exceptional
93.5%
Immigrants | Israel
98.8
/100
|
#98
Exceptional
93.5%
Menominee
98.7
/100
|
#99
Exceptional
93.5%
Immigrants | North Macedonia
98.7
/100
|
#100
Exceptional
93.5%
Immigrants | Romania
98.7
/100
|
#101
Exceptional
93.5%
Chippewa
98.6
/100
|
#102
Exceptional
93.5%
Lebanese
98.6
/100
|
#103
Exceptional
93.5%
Immigrants | Europe
98.6
/100
|
#104
Exceptional
93.5%
Immigrants | Serbia
98.6
/100
|
#105
Exceptional
93.5%

Demographics Similar to Paiute by 11th Grade

In terms of 11th grade, the demographic groups most similar to Paiute are Immigrants from Trinidad and Tobago (90.9%, a difference of 0.040%), Immigrants from Peru (91.0%, a difference of 0.050%), West Indian (91.0%, a difference of 0.050%), Immigrants from South Eastern Asia (90.9%, a difference of 0.050%), and Trinidadian and Tobagonian (91.1%, a difference of 0.080%).
DemographicsRating | Rank11th Grade
Immigrants | Western Africa
0.3
/100
|
#266
Tragic
91.2%
Immigrants | Jamaica
0.3
/100
|
#267
Tragic
91.2%
U.S. Virgin Islanders
0.2
/100
|
#268
Tragic
91.1%
Ute
0.2
/100
|
#269
Tragic
91.1%
Trinidadians and Tobagonians
0.2
/100
|
#270
Tragic
91.1%
Immigrants | Peru
0.1
/100
|
#271
Tragic
91.0%
West Indians
0.1
/100
|
#272
Tragic
91.0%
Paiute
0.1
/100
|
#273
Tragic
91.0%
Immigrants | Trinidad and Tobago
0.1
/100
|
#274
Tragic
90.9%
Immigrants | South Eastern Asia
0.1
/100
|
#275
Tragic
90.9%
Bangladeshis
0.1
/100
|
#276
Tragic
90.9%
Immigrants | Congo
0.1
/100
|
#277
Tragic
90.9%
Malaysians
0.1
/100
|
#278
Tragic
90.8%
Barbadians
0.0
/100
|
#279
Tragic
90.8%
Sri Lankans
0.0
/100
|
#280
Tragic
90.7%