Filipino vs Paiute Family Households with Children
COMPARE
Filipino
Paiute
Family Households with Children
Family Households with Children Comparison
Filipinos
Paiute
28.6%
FAMILY HOUSEHOLDS WITH CHILDREN
99.9/ 100
METRIC RATING
64th/ 347
METRIC RANK
26.4%
FAMILY HOUSEHOLDS WITH CHILDREN
0.1/ 100
METRIC RATING
300th/ 347
METRIC RANK
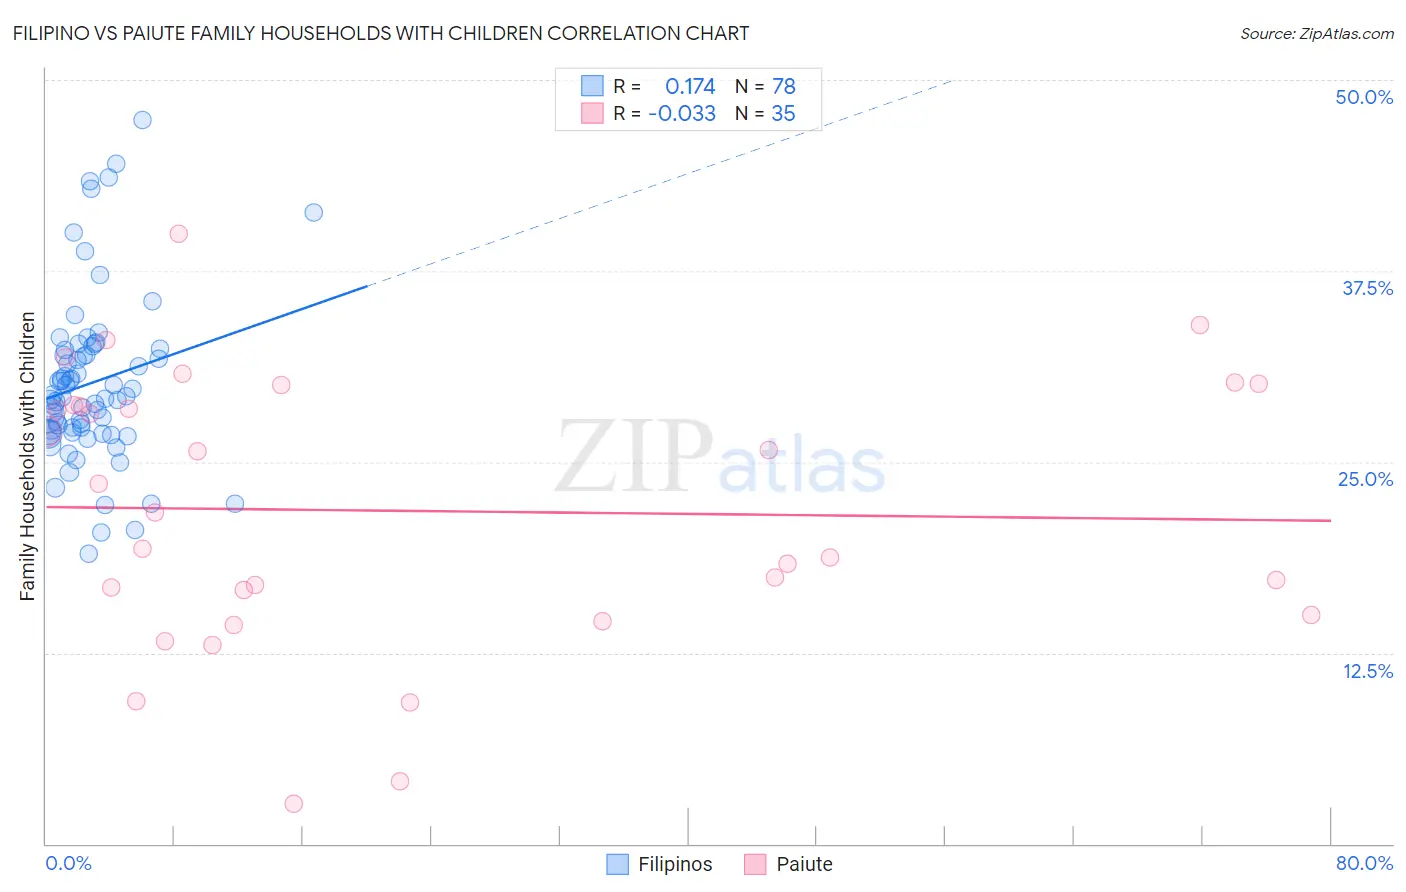
Filipino vs Paiute Family Households with Children Correlation Chart
The statistical analysis conducted on geographies consisting of 254,080,419 people shows a poor positive correlation between the proportion of Filipinos and percentage of family households with children in the United States with a correlation coefficient (R) of 0.174 and weighted average of 28.6%. Similarly, the statistical analysis conducted on geographies consisting of 58,389,869 people shows no correlation between the proportion of Paiute and percentage of family households with children in the United States with a correlation coefficient (R) of -0.033 and weighted average of 26.4%, a difference of 8.3%.
Family Households with Children Correlation Summary
| Measurement | Filipino | Paiute |
| Minimum | 19.0% | 2.7% |
| Maximum | 47.3% | 40.0% |
| Range | 28.4% | 37.3% |
| Mean | 30.2% | 21.8% |
| Median | 29.3% | 21.6% |
| Interquartile 25% (IQ1) | 26.9% | 15.0% |
| Interquartile 75% (IQ3) | 32.4% | 28.7% |
| Interquartile Range (IQR) | 5.4% | 13.8% |
| Standard Deviation (Sample) | 5.5% | 8.9% |
| Standard Deviation (Population) | 5.5% | 8.8% |
Similar Demographics by Family Households with Children
Demographics Similar to Filipinos by Family Households with Children
In terms of family households with children, the demographic groups most similar to Filipinos are Immigrants from Lebanon (28.6%, a difference of 0.070%), Immigrants from Ghana (28.6%, a difference of 0.080%), Egyptian (28.6%, a difference of 0.080%), Honduran (28.5%, a difference of 0.080%), and Immigrants from Egypt (28.5%, a difference of 0.080%).
| Demographics | Rating | Rank | Family Households with Children |
| Danes | 100.0 /100 | #57 | Exceptional 28.7% |
| Hawaiians | 100.0 /100 | #58 | Exceptional 28.7% |
| Immigrants | Nigeria | 100.0 /100 | #59 | Exceptional 28.6% |
| Hmong | 99.9 /100 | #60 | Exceptional 28.6% |
| Immigrants | Ghana | 99.9 /100 | #61 | Exceptional 28.6% |
| Egyptians | 99.9 /100 | #62 | Exceptional 28.6% |
| Immigrants | Lebanon | 99.9 /100 | #63 | Exceptional 28.6% |
| Filipinos | 99.9 /100 | #64 | Exceptional 28.6% |
| Hondurans | 99.9 /100 | #65 | Exceptional 28.5% |
| Immigrants | Egypt | 99.9 /100 | #66 | Exceptional 28.5% |
| Ghanaians | 99.9 /100 | #67 | Exceptional 28.5% |
| Houma | 99.9 /100 | #68 | Exceptional 28.5% |
| Immigrants | Korea | 99.9 /100 | #69 | Exceptional 28.5% |
| Immigrants | Honduras | 99.9 /100 | #70 | Exceptional 28.5% |
| Burmese | 99.9 /100 | #71 | Exceptional 28.5% |
Demographics Similar to Paiute by Family Households with Children
In terms of family households with children, the demographic groups most similar to Paiute are Immigrants from Trinidad and Tobago (26.4%, a difference of 0.020%), Serbian (26.4%, a difference of 0.030%), Immigrants from Guyana (26.3%, a difference of 0.060%), Immigrants from Bahamas (26.3%, a difference of 0.11%), and Trinidadian and Tobagonian (26.4%, a difference of 0.12%).
| Demographics | Rating | Rank | Family Households with Children |
| Blacks/African Americans | 0.1 /100 | #293 | Tragic 26.5% |
| Latvians | 0.1 /100 | #294 | Tragic 26.4% |
| Macedonians | 0.1 /100 | #295 | Tragic 26.4% |
| Croatians | 0.1 /100 | #296 | Tragic 26.4% |
| Armenians | 0.1 /100 | #297 | Tragic 26.4% |
| Immigrants | Western Europe | 0.1 /100 | #298 | Tragic 26.4% |
| Trinidadians and Tobagonians | 0.1 /100 | #299 | Tragic 26.4% |
| Paiute | 0.1 /100 | #300 | Tragic 26.4% |
| Immigrants | Trinidad and Tobago | 0.1 /100 | #301 | Tragic 26.4% |
| Serbians | 0.1 /100 | #302 | Tragic 26.4% |
| Immigrants | Guyana | 0.1 /100 | #303 | Tragic 26.3% |
| Immigrants | Bahamas | 0.1 /100 | #304 | Tragic 26.3% |
| Guyanese | 0.1 /100 | #305 | Tragic 26.3% |
| Bermudans | 0.1 /100 | #306 | Tragic 26.3% |
| West Indians | 0.0 /100 | #307 | Tragic 26.3% |