Immigrants from Iraq vs Armenian Family Households
COMPARE
Immigrants from Iraq
Armenian
Family Households
Family Households Comparison
Immigrants from Iraq
Armenians
65.0%
FAMILY HOUSEHOLDS
95.4/ 100
METRIC RATING
116th/ 347
METRIC RANK
64.4%
FAMILY HOUSEHOLDS
55.9/ 100
METRIC RATING
170th/ 347
METRIC RANK
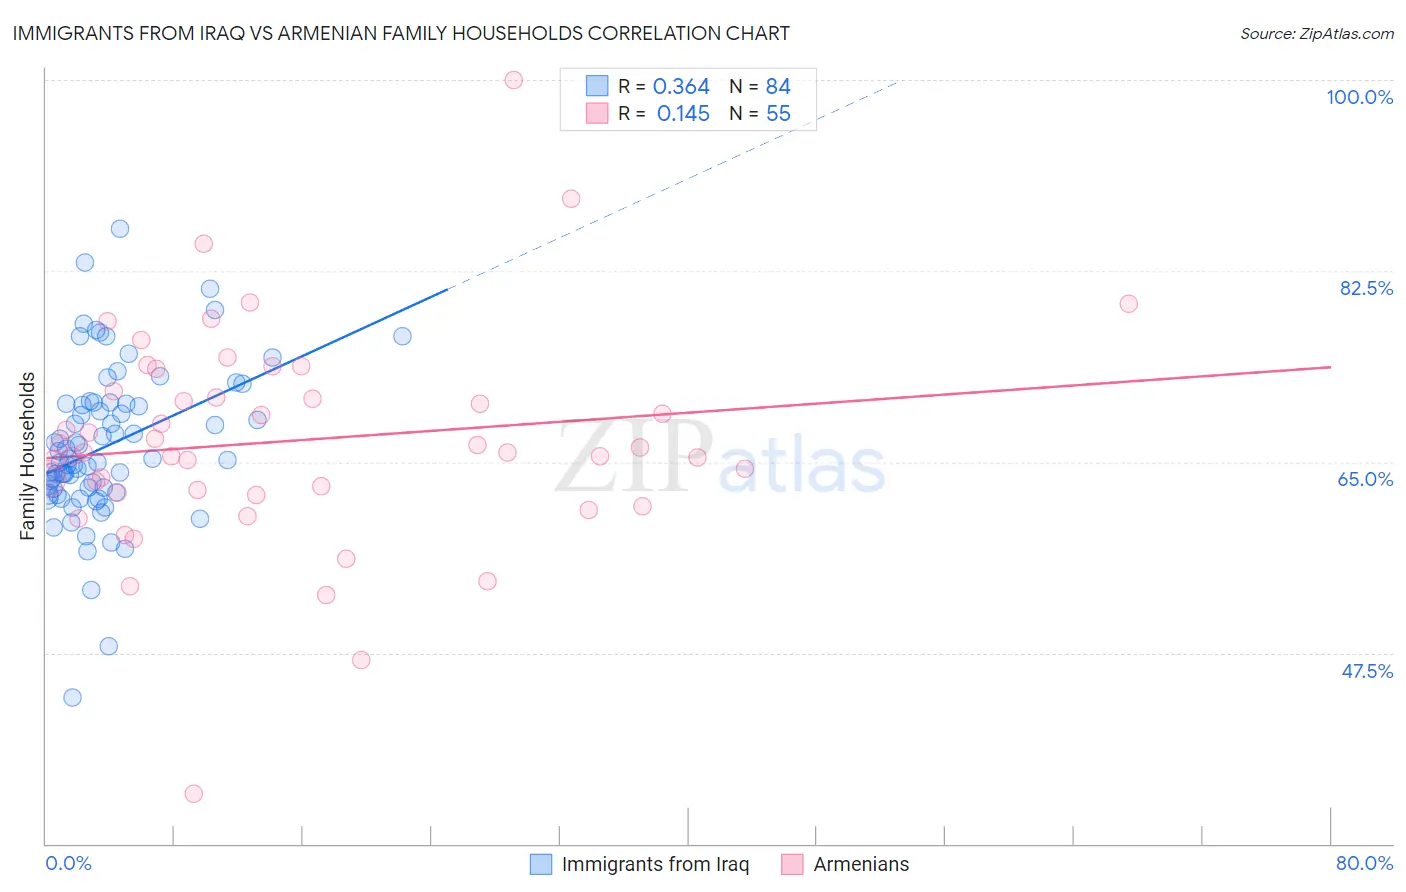
Immigrants from Iraq vs Armenian Family Households Correlation Chart
The statistical analysis conducted on geographies consisting of 194,748,040 people shows a mild positive correlation between the proportion of Immigrants from Iraq and percentage of family households in the United States with a correlation coefficient (R) of 0.364 and weighted average of 65.0%. Similarly, the statistical analysis conducted on geographies consisting of 310,784,197 people shows a poor positive correlation between the proportion of Armenians and percentage of family households in the United States with a correlation coefficient (R) of 0.145 and weighted average of 64.4%, a difference of 0.94%.
Family Households Correlation Summary
| Measurement | Immigrants from Iraq | Armenian |
| Minimum | 43.4% | 34.5% |
| Maximum | 86.3% | 100.0% |
| Range | 43.0% | 65.5% |
| Mean | 66.4% | 66.9% |
| Median | 65.2% | 65.9% |
| Interquartile 25% (IQ1) | 62.3% | 62.2% |
| Interquartile 75% (IQ3) | 70.4% | 71.4% |
| Interquartile Range (IQR) | 8.0% | 9.3% |
| Standard Deviation (Sample) | 7.1% | 10.1% |
| Standard Deviation (Population) | 7.0% | 10.0% |
Similar Demographics by Family Households
Demographics Similar to Immigrants from Iraq by Family Households
In terms of family households, the demographic groups most similar to Immigrants from Iraq are Ecuadorian (65.0%, a difference of 0.0%), Cherokee (65.0%, a difference of 0.0%), Dutch (64.9%, a difference of 0.020%), Argentinean (65.0%, a difference of 0.030%), and Spanish (65.0%, a difference of 0.070%).
| Demographics | Rating | Rank | Family Households |
| Immigrants | Guatemala | 96.9 /100 | #109 | Exceptional 65.0% |
| Scandinavians | 96.8 /100 | #110 | Exceptional 65.0% |
| Europeans | 96.8 /100 | #111 | Exceptional 65.0% |
| Immigrants | Jordan | 96.5 /100 | #112 | Exceptional 65.0% |
| Spanish | 96.2 /100 | #113 | Exceptional 65.0% |
| Argentineans | 95.7 /100 | #114 | Exceptional 65.0% |
| Ecuadorians | 95.4 /100 | #115 | Exceptional 65.0% |
| Immigrants | Iraq | 95.4 /100 | #116 | Exceptional 65.0% |
| Cherokee | 95.3 /100 | #117 | Exceptional 65.0% |
| Dutch | 95.1 /100 | #118 | Exceptional 64.9% |
| Immigrants | Eastern Asia | 94.4 /100 | #119 | Exceptional 64.9% |
| Immigrants | Oceania | 94.2 /100 | #120 | Exceptional 64.9% |
| Hungarians | 94.0 /100 | #121 | Exceptional 64.9% |
| Hmong | 93.4 /100 | #122 | Exceptional 64.9% |
| Choctaw | 93.4 /100 | #123 | Exceptional 64.9% |
Demographics Similar to Armenians by Family Households
In terms of family households, the demographic groups most similar to Armenians are Iraqi (64.4%, a difference of 0.0%), Honduran (64.4%, a difference of 0.020%), Ute (64.3%, a difference of 0.020%), Irish (64.4%, a difference of 0.030%), and Dutch West Indian (64.3%, a difference of 0.030%).
| Demographics | Rating | Rank | Family Households |
| Chickasaw | 61.5 /100 | #163 | Good 64.4% |
| Immigrants | Nigeria | 60.1 /100 | #164 | Good 64.4% |
| Immigrants | Southern Europe | 60.0 /100 | #165 | Good 64.4% |
| Scotch-Irish | 59.2 /100 | #166 | Average 64.4% |
| Irish | 57.9 /100 | #167 | Average 64.4% |
| Hondurans | 57.5 /100 | #168 | Average 64.4% |
| Iraqis | 56.0 /100 | #169 | Average 64.4% |
| Armenians | 55.9 /100 | #170 | Average 64.4% |
| Ute | 54.6 /100 | #171 | Average 64.3% |
| Dutch West Indians | 53.9 /100 | #172 | Average 64.3% |
| Immigrants | Sierra Leone | 52.5 /100 | #173 | Average 64.3% |
| Immigrants | Germany | 50.0 /100 | #174 | Average 64.3% |
| Bangladeshis | 44.3 /100 | #175 | Average 64.3% |
| Vietnamese | 43.6 /100 | #176 | Average 64.2% |
| Immigrants | Micronesia | 42.3 /100 | #177 | Average 64.2% |