Immigrants from Indonesia vs Italian Single Father Households
COMPARE
Immigrants from Indonesia
Italian
Single Father Households
Single Father Households Comparison
Immigrants from Indonesia
Italians
2.2%
SINGLE FATHER HOUSEHOLDS
97.4/ 100
METRIC RATING
125th/ 347
METRIC RANK
2.2%
SINGLE FATHER HOUSEHOLDS
98.3/ 100
METRIC RATING
110th/ 347
METRIC RANK
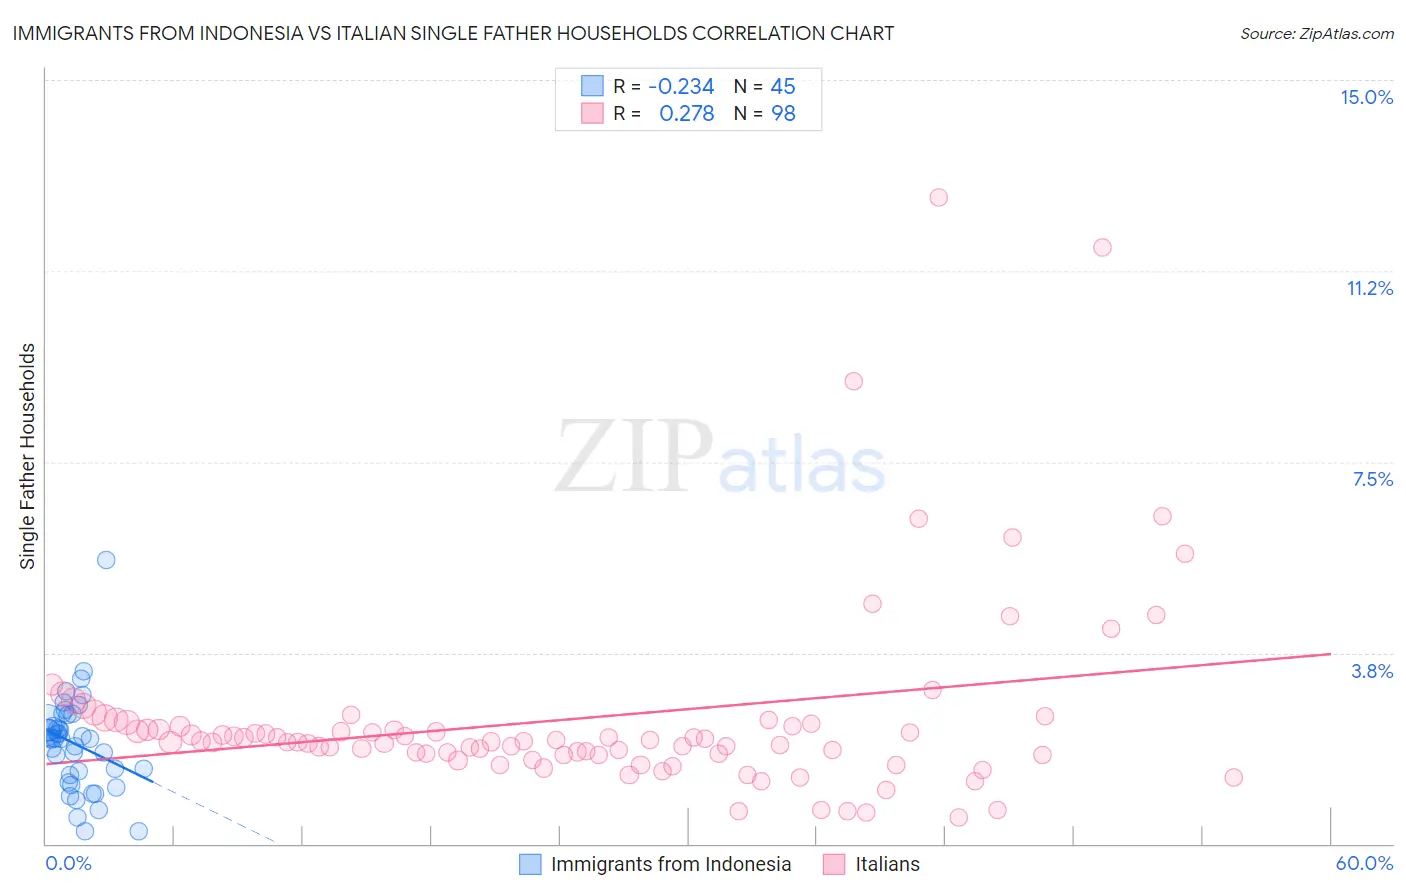
Immigrants from Indonesia vs Italian Single Father Households Correlation Chart
The statistical analysis conducted on geographies consisting of 214,943,478 people shows a weak negative correlation between the proportion of Immigrants from Indonesia and percentage of single father households in the United States with a correlation coefficient (R) of -0.234 and weighted average of 2.2%. Similarly, the statistical analysis conducted on geographies consisting of 559,287,230 people shows a weak positive correlation between the proportion of Italians and percentage of single father households in the United States with a correlation coefficient (R) of 0.278 and weighted average of 2.2%, a difference of 0.94%.
Single Father Households Correlation Summary
| Measurement | Immigrants from Indonesia | Italian |
| Minimum | 0.25% | 0.51% |
| Maximum | 5.6% | 12.7% |
| Range | 5.3% | 12.2% |
| Mean | 2.0% | 2.5% |
| Median | 2.1% | 2.0% |
| Interquartile 25% (IQ1) | 1.3% | 1.8% |
| Interquartile 75% (IQ3) | 2.5% | 2.3% |
| Interquartile Range (IQR) | 1.2% | 0.56% |
| Standard Deviation (Sample) | 0.94% | 1.9% |
| Standard Deviation (Population) | 0.93% | 1.9% |
Demographics Similar to Immigrants from Indonesia and Italians by Single Father Households
In terms of single father households, the demographic groups most similar to Immigrants from Indonesia are British West Indian (2.2%, a difference of 0.050%), Immigrants from Yemen (2.2%, a difference of 0.070%), Immigrants from Iraq (2.2%, a difference of 0.22%), Moroccan (2.2%, a difference of 0.31%), and Jordanian (2.2%, a difference of 0.31%). Similarly, the demographic groups most similar to Italians are Immigrants from Canada (2.2%, a difference of 0.080%), Immigrants from Trinidad and Tobago (2.2%, a difference of 0.12%), Barbadian (2.2%, a difference of 0.13%), Iraqi (2.2%, a difference of 0.13%), and Immigrants from Netherlands (2.2%, a difference of 0.16%).
| Demographics | Rating | Rank | Single Father Households |
| Slovenes | 98.5 /100 | #107 | Exceptional 2.2% |
| Immigrants | Netherlands | 98.5 /100 | #108 | Exceptional 2.2% |
| Barbadians | 98.4 /100 | #109 | Exceptional 2.2% |
| Italians | 98.3 /100 | #110 | Exceptional 2.2% |
| Immigrants | Canada | 98.3 /100 | #111 | Exceptional 2.2% |
| Immigrants | Trinidad and Tobago | 98.2 /100 | #112 | Exceptional 2.2% |
| Iraqis | 98.2 /100 | #113 | Exceptional 2.2% |
| Immigrants | North America | 98.2 /100 | #114 | Exceptional 2.2% |
| Immigrants | Barbados | 98.2 /100 | #115 | Exceptional 2.2% |
| Immigrants | Argentina | 98.1 /100 | #116 | Exceptional 2.2% |
| Hungarians | 97.9 /100 | #117 | Exceptional 2.2% |
| Immigrants | Morocco | 97.8 /100 | #118 | Exceptional 2.2% |
| Trinidadians and Tobagonians | 97.8 /100 | #119 | Exceptional 2.2% |
| Australians | 97.7 /100 | #120 | Exceptional 2.2% |
| Immigrants | Brazil | 97.7 /100 | #121 | Exceptional 2.2% |
| Immigrants | Iraq | 97.6 /100 | #122 | Exceptional 2.2% |
| Immigrants | Yemen | 97.5 /100 | #123 | Exceptional 2.2% |
| British West Indians | 97.4 /100 | #124 | Exceptional 2.2% |
| Immigrants | Indonesia | 97.4 /100 | #125 | Exceptional 2.2% |
| Moroccans | 96.9 /100 | #126 | Exceptional 2.2% |
| Jordanians | 96.9 /100 | #127 | Exceptional 2.2% |