Finnish vs Lithuanian Single Father Households
COMPARE
Finnish
Lithuanian
Single Father Households
Single Father Households Comparison
Finns
Lithuanians
2.4%
SINGLE FATHER HOUSEHOLDS
18.3/ 100
METRIC RATING
212th/ 347
METRIC RANK
2.1%
SINGLE FATHER HOUSEHOLDS
99.5/ 100
METRIC RATING
87th/ 347
METRIC RANK
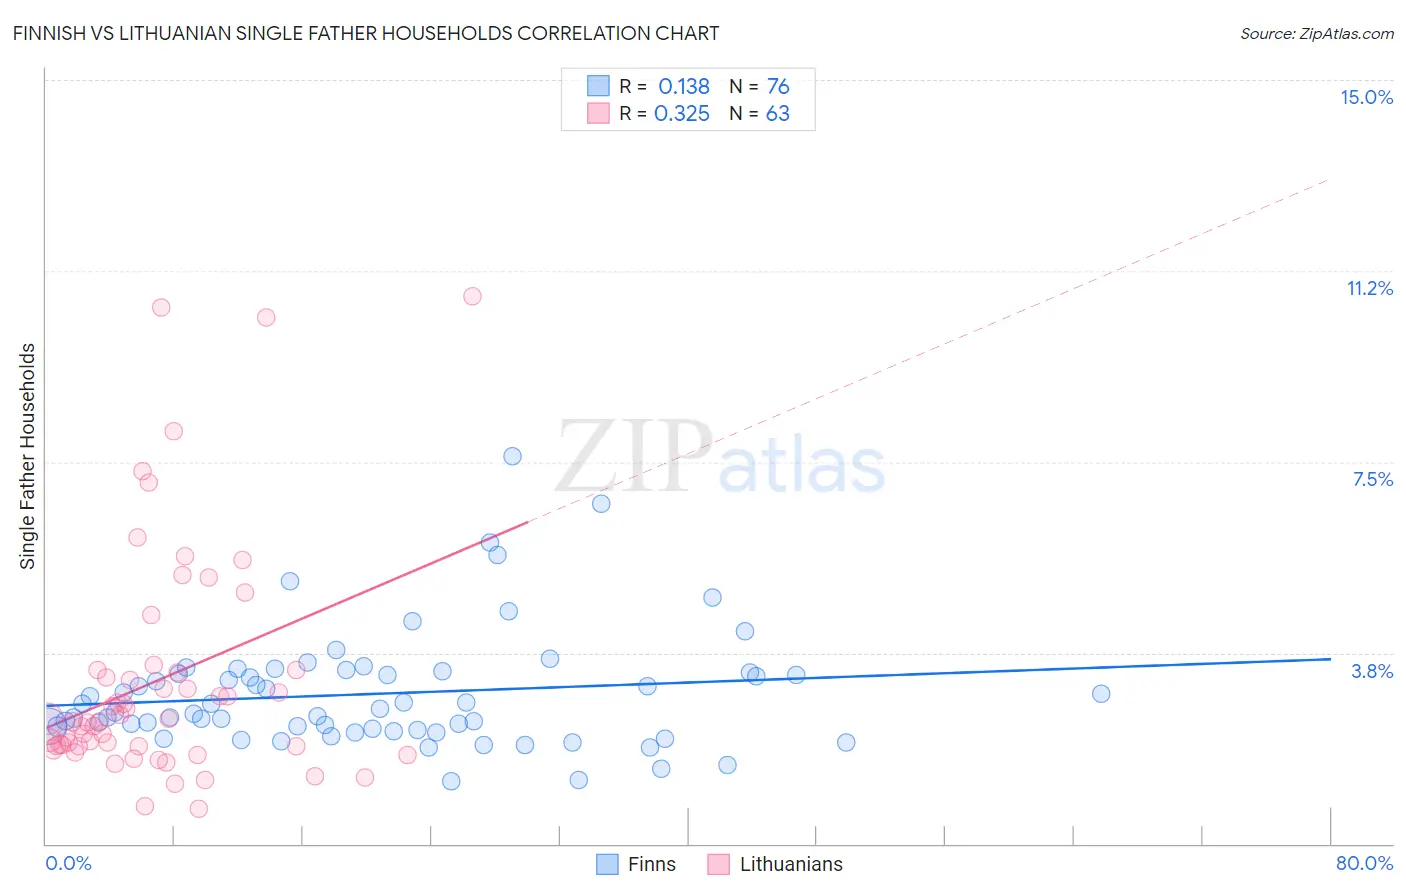
Finnish vs Lithuanian Single Father Households Correlation Chart
The statistical analysis conducted on geographies consisting of 400,074,189 people shows a poor positive correlation between the proportion of Finns and percentage of single father households in the United States with a correlation coefficient (R) of 0.138 and weighted average of 2.4%. Similarly, the statistical analysis conducted on geographies consisting of 416,616,302 people shows a mild positive correlation between the proportion of Lithuanians and percentage of single father households in the United States with a correlation coefficient (R) of 0.325 and weighted average of 2.1%, a difference of 13.8%.
Single Father Households Correlation Summary
| Measurement | Finnish | Lithuanian |
| Minimum | 1.2% | 0.69% |
| Maximum | 7.6% | 10.7% |
| Range | 6.4% | 10.0% |
| Mean | 2.9% | 3.2% |
| Median | 2.6% | 2.4% |
| Interquartile 25% (IQ1) | 2.2% | 1.9% |
| Interquartile 75% (IQ3) | 3.4% | 3.4% |
| Interquartile Range (IQR) | 1.1% | 1.5% |
| Standard Deviation (Sample) | 1.1% | 2.3% |
| Standard Deviation (Population) | 1.1% | 2.3% |
Similar Demographics by Single Father Households
Demographics Similar to Finns by Single Father Households
In terms of single father households, the demographic groups most similar to Finns are Immigrants from Nigeria (2.4%, a difference of 0.050%), Immigrants from Costa Rica (2.4%, a difference of 0.10%), Immigrants from Peru (2.4%, a difference of 0.11%), Norwegian (2.4%, a difference of 0.15%), and Ethiopian (2.4%, a difference of 0.21%).
| Demographics | Rating | Rank | Single Father Households |
| Immigrants | Afghanistan | 24.2 /100 | #205 | Fair 2.4% |
| Koreans | 24.1 /100 | #206 | Fair 2.4% |
| Whites/Caucasians | 22.6 /100 | #207 | Fair 2.4% |
| Immigrants | Kenya | 20.3 /100 | #208 | Fair 2.4% |
| Immigrants | Peru | 19.3 /100 | #209 | Poor 2.4% |
| Immigrants | Costa Rica | 19.2 /100 | #210 | Poor 2.4% |
| Immigrants | Nigeria | 18.7 /100 | #211 | Poor 2.4% |
| Finns | 18.3 /100 | #212 | Poor 2.4% |
| Norwegians | 17.1 /100 | #213 | Poor 2.4% |
| Ethiopians | 16.6 /100 | #214 | Poor 2.4% |
| Immigrants | South Eastern Asia | 15.9 /100 | #215 | Poor 2.4% |
| Immigrants | Ecuador | 14.9 /100 | #216 | Poor 2.4% |
| Dutch | 14.3 /100 | #217 | Poor 2.4% |
| Immigrants | Ethiopia | 13.4 /100 | #218 | Poor 2.4% |
| Sudanese | 13.0 /100 | #219 | Poor 2.4% |
Demographics Similar to Lithuanians by Single Father Households
In terms of single father households, the demographic groups most similar to Lithuanians are Bhutanese (2.1%, a difference of 0.13%), Immigrants from Armenia (2.1%, a difference of 0.18%), Immigrants from Pakistan (2.1%, a difference of 0.19%), Immigrants from Guyana (2.1%, a difference of 0.43%), and Asian (2.1%, a difference of 0.51%).
| Demographics | Rating | Rank | Single Father Households |
| Immigrants | South Africa | 99.7 /100 | #80 | Exceptional 2.1% |
| Armenians | 99.7 /100 | #81 | Exceptional 2.1% |
| New Zealanders | 99.7 /100 | #82 | Exceptional 2.1% |
| Greeks | 99.7 /100 | #83 | Exceptional 2.1% |
| Carpatho Rusyns | 99.6 /100 | #84 | Exceptional 2.1% |
| Immigrants | Hungary | 99.6 /100 | #85 | Exceptional 2.1% |
| Asians | 99.6 /100 | #86 | Exceptional 2.1% |
| Lithuanians | 99.5 /100 | #87 | Exceptional 2.1% |
| Bhutanese | 99.5 /100 | #88 | Exceptional 2.1% |
| Immigrants | Armenia | 99.5 /100 | #89 | Exceptional 2.1% |
| Immigrants | Pakistan | 99.5 /100 | #90 | Exceptional 2.1% |
| Immigrants | Guyana | 99.4 /100 | #91 | Exceptional 2.1% |
| Romanians | 99.4 /100 | #92 | Exceptional 2.1% |
| Croatians | 99.3 /100 | #93 | Exceptional 2.1% |
| Ukrainians | 99.3 /100 | #94 | Exceptional 2.1% |