Immigrants from Haiti vs Immigrants from Peru Currently Married
COMPARE
Immigrants from Haiti
Immigrants from Peru
Currently Married
Currently Married Comparison
Immigrants from Haiti
Immigrants from Peru
41.0%
CURRENTLY MARRIED
0.0/ 100
METRIC RATING
322nd/ 347
METRIC RANK
46.4%
CURRENTLY MARRIED
35.3/ 100
METRIC RATING
187th/ 347
METRIC RANK
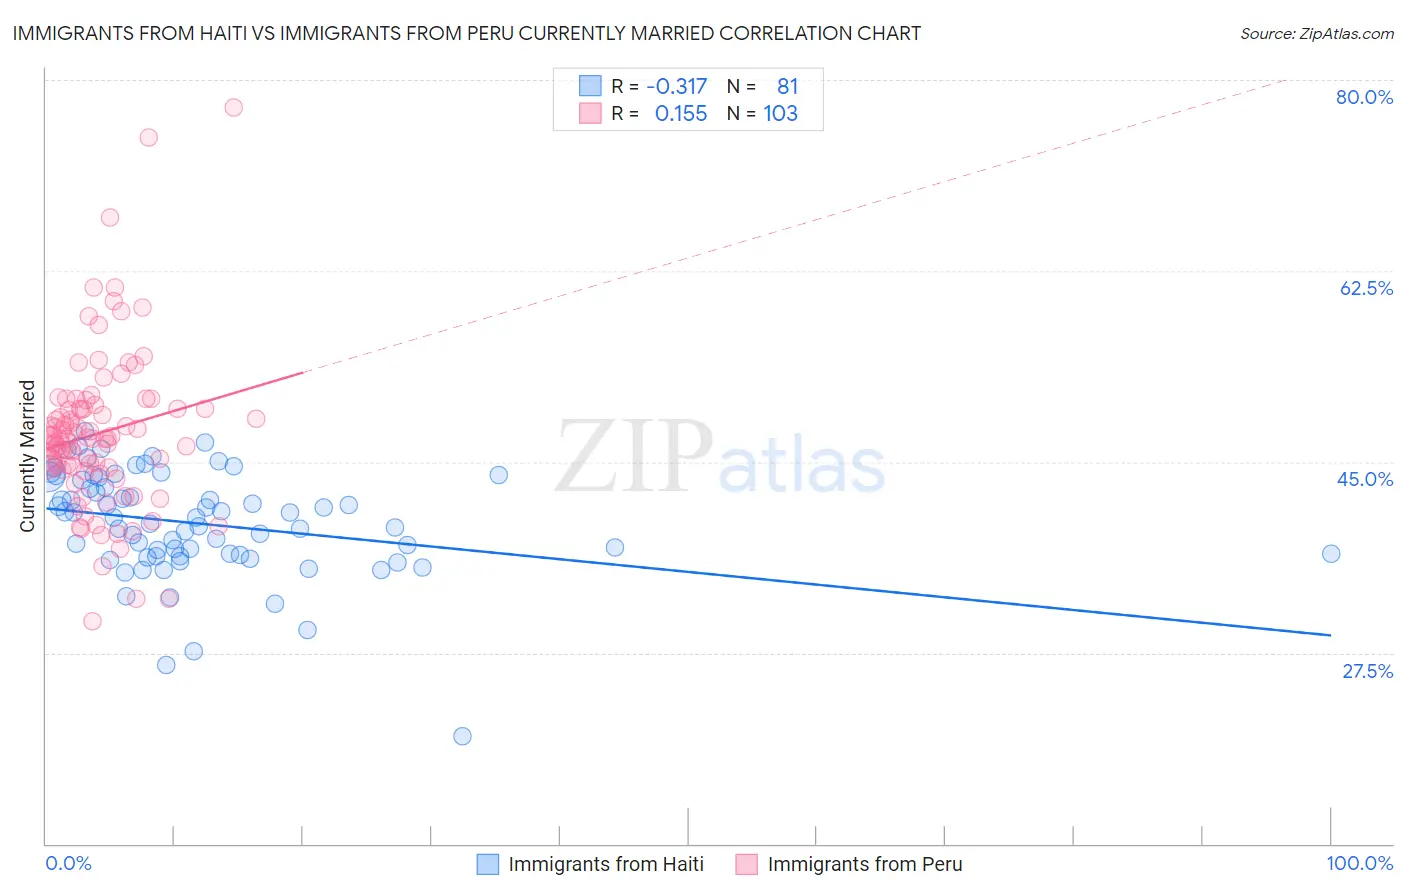
Immigrants from Haiti vs Immigrants from Peru Currently Married Correlation Chart
The statistical analysis conducted on geographies consisting of 225,264,174 people shows a mild negative correlation between the proportion of Immigrants from Haiti and percentage of population currently married in the United States with a correlation coefficient (R) of -0.317 and weighted average of 41.0%. Similarly, the statistical analysis conducted on geographies consisting of 328,847,084 people shows a poor positive correlation between the proportion of Immigrants from Peru and percentage of population currently married in the United States with a correlation coefficient (R) of 0.155 and weighted average of 46.4%, a difference of 13.1%.
Currently Married Correlation Summary
| Measurement | Immigrants from Haiti | Immigrants from Peru |
| Minimum | 19.9% | 30.4% |
| Maximum | 47.8% | 77.5% |
| Range | 27.9% | 47.1% |
| Mean | 39.3% | 47.6% |
| Median | 39.9% | 47.2% |
| Interquartile 25% (IQ1) | 36.4% | 44.5% |
| Interquartile 75% (IQ3) | 43.5% | 49.9% |
| Interquartile Range (IQR) | 7.1% | 5.4% |
| Standard Deviation (Sample) | 4.9% | 7.3% |
| Standard Deviation (Population) | 4.9% | 7.3% |
Similar Demographics by Currently Married
Demographics Similar to Immigrants from Haiti by Currently Married
In terms of currently married, the demographic groups most similar to Immigrants from Haiti are Immigrants from Congo (41.1%, a difference of 0.13%), Immigrants from Jamaica (41.1%, a difference of 0.36%), Immigrants from Somalia (41.2%, a difference of 0.43%), Bahamian (41.2%, a difference of 0.44%), and Haitian (41.3%, a difference of 0.63%).
| Demographics | Rating | Rank | Currently Married |
| Inupiat | 0.0 /100 | #315 | Tragic 41.3% |
| Immigrants | Caribbean | 0.0 /100 | #316 | Tragic 41.3% |
| Haitians | 0.0 /100 | #317 | Tragic 41.3% |
| Bahamians | 0.0 /100 | #318 | Tragic 41.2% |
| Immigrants | Somalia | 0.0 /100 | #319 | Tragic 41.2% |
| Immigrants | Jamaica | 0.0 /100 | #320 | Tragic 41.1% |
| Immigrants | Congo | 0.0 /100 | #321 | Tragic 41.1% |
| Immigrants | Haiti | 0.0 /100 | #322 | Tragic 41.0% |
| Immigrants | West Indies | 0.0 /100 | #323 | Tragic 40.7% |
| Immigrants | Senegal | 0.0 /100 | #324 | Tragic 40.7% |
| U.S. Virgin Islanders | 0.0 /100 | #325 | Tragic 40.7% |
| Barbadians | 0.0 /100 | #326 | Tragic 40.6% |
| Senegalese | 0.0 /100 | #327 | Tragic 40.6% |
| Arapaho | 0.0 /100 | #328 | Tragic 40.5% |
| Crow | 0.0 /100 | #329 | Tragic 40.4% |
Demographics Similar to Immigrants from Peru by Currently Married
In terms of currently married, the demographic groups most similar to Immigrants from Peru are Immigrants from Chile (46.4%, a difference of 0.060%), Mongolian (46.4%, a difference of 0.090%), Colombian (46.3%, a difference of 0.14%), Brazilian (46.4%, a difference of 0.16%), and Immigrants from Northern Africa (46.5%, a difference of 0.17%).
| Demographics | Rating | Rank | Currently Married |
| Costa Ricans | 43.7 /100 | #180 | Average 46.5% |
| Ottawa | 43.0 /100 | #181 | Average 46.5% |
| Potawatomi | 41.9 /100 | #182 | Average 46.5% |
| Immigrants | Northern Africa | 39.7 /100 | #183 | Fair 46.5% |
| Brazilians | 39.3 /100 | #184 | Fair 46.4% |
| Mongolians | 37.6 /100 | #185 | Fair 46.4% |
| Immigrants | Chile | 36.8 /100 | #186 | Fair 46.4% |
| Immigrants | Peru | 35.3 /100 | #187 | Fair 46.4% |
| Colombians | 31.8 /100 | #188 | Fair 46.3% |
| Fijians | 30.3 /100 | #189 | Fair 46.3% |
| Choctaw | 29.1 /100 | #190 | Fair 46.3% |
| Immigrants | France | 27.7 /100 | #191 | Fair 46.2% |
| Soviet Union | 25.7 /100 | #192 | Fair 46.2% |
| Immigrants | Fiji | 25.0 /100 | #193 | Fair 46.2% |
| South Americans | 23.8 /100 | #194 | Fair 46.1% |