Immigrants from Guyana vs Swedish Family Households
COMPARE
Immigrants from Guyana
Swedish
Family Households
Family Households Comparison
Immigrants from Guyana
Swedes
65.5%
FAMILY HOUSEHOLDS
99.6/ 100
METRIC RATING
83rd/ 347
METRIC RANK
64.5%
FAMILY HOUSEHOLDS
69.8/ 100
METRIC RATING
153rd/ 347
METRIC RANK
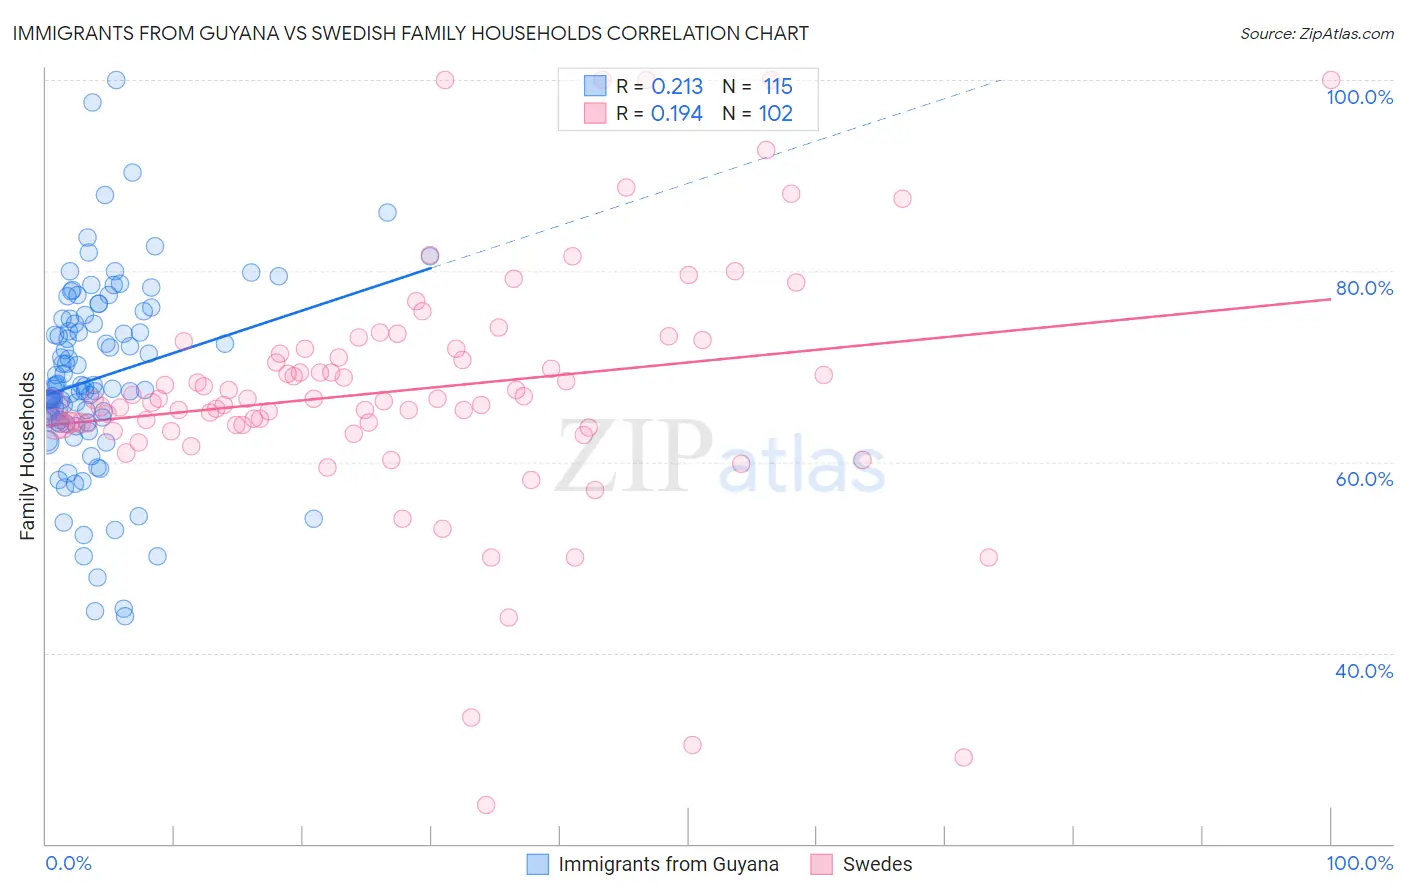
Immigrants from Guyana vs Swedish Family Households Correlation Chart
The statistical analysis conducted on geographies consisting of 183,692,890 people shows a weak positive correlation between the proportion of Immigrants from Guyana and percentage of family households in the United States with a correlation coefficient (R) of 0.213 and weighted average of 65.5%. Similarly, the statistical analysis conducted on geographies consisting of 538,762,235 people shows a poor positive correlation between the proportion of Swedes and percentage of family households in the United States with a correlation coefficient (R) of 0.194 and weighted average of 64.5%, a difference of 1.6%.
Family Households Correlation Summary
| Measurement | Immigrants from Guyana | Swedish |
| Minimum | 43.8% | 24.0% |
| Maximum | 100.0% | 100.0% |
| Range | 56.2% | 76.0% |
| Mean | 68.8% | 67.5% |
| Median | 67.6% | 66.4% |
| Interquartile 25% (IQ1) | 64.1% | 63.8% |
| Interquartile 75% (IQ3) | 74.9% | 71.8% |
| Interquartile Range (IQR) | 10.8% | 8.0% |
| Standard Deviation (Sample) | 9.8% | 13.1% |
| Standard Deviation (Population) | 9.8% | 13.0% |
Similar Demographics by Family Households
Demographics Similar to Immigrants from Guyana by Family Households
In terms of family households, the demographic groups most similar to Immigrants from Guyana are Immigrants from Lebanon (65.5%, a difference of 0.010%), American (65.5%, a difference of 0.020%), Jordanian (65.5%, a difference of 0.040%), Puget Sound Salish (65.6%, a difference of 0.13%), and Immigrants from Cambodia (65.4%, a difference of 0.13%).
| Demographics | Rating | Rank | Family Households |
| Immigrants | Azores | 99.8 /100 | #76 | Exceptional 65.6% |
| Immigrants | South America | 99.8 /100 | #77 | Exceptional 65.6% |
| Yaqui | 99.8 /100 | #78 | Exceptional 65.6% |
| Immigrants | Costa Rica | 99.8 /100 | #79 | Exceptional 65.6% |
| Puget Sound Salish | 99.8 /100 | #80 | Exceptional 65.6% |
| Jordanians | 99.7 /100 | #81 | Exceptional 65.5% |
| Immigrants | Lebanon | 99.7 /100 | #82 | Exceptional 65.5% |
| Immigrants | Guyana | 99.6 /100 | #83 | Exceptional 65.5% |
| Americans | 99.6 /100 | #84 | Exceptional 65.5% |
| Immigrants | Cambodia | 99.5 /100 | #85 | Exceptional 65.4% |
| Egyptians | 99.4 /100 | #86 | Exceptional 65.4% |
| Immigrants | Egypt | 99.2 /100 | #87 | Exceptional 65.3% |
| Immigrants | Haiti | 99.1 /100 | #88 | Exceptional 65.3% |
| Immigrants | Caribbean | 99.1 /100 | #89 | Exceptional 65.3% |
| Immigrants | Laos | 99.1 /100 | #90 | Exceptional 65.3% |
Demographics Similar to Swedes by Family Households
In terms of family households, the demographic groups most similar to Swedes are Scottish (64.5%, a difference of 0.020%), Austrian (64.5%, a difference of 0.020%), Uruguayan (64.5%, a difference of 0.030%), Czech (64.5%, a difference of 0.040%), and Canadian (64.4%, a difference of 0.050%).
| Demographics | Rating | Rank | Family Households |
| Immigrants | Romania | 77.0 /100 | #146 | Good 64.6% |
| Immigrants | Chile | 76.5 /100 | #147 | Good 64.6% |
| Delaware | 76.3 /100 | #148 | Good 64.6% |
| Sioux | 76.3 /100 | #149 | Good 64.6% |
| Romanians | 75.3 /100 | #150 | Good 64.5% |
| Syrians | 75.2 /100 | #151 | Good 64.5% |
| Scottish | 70.9 /100 | #152 | Good 64.5% |
| Swedes | 69.8 /100 | #153 | Good 64.5% |
| Austrians | 68.5 /100 | #154 | Good 64.5% |
| Uruguayans | 67.7 /100 | #155 | Good 64.5% |
| Czechs | 67.0 /100 | #156 | Good 64.5% |
| Canadians | 66.6 /100 | #157 | Good 64.4% |
| Lebanese | 66.4 /100 | #158 | Good 64.4% |
| Germans | 65.8 /100 | #159 | Good 64.4% |
| Immigrants | Moldova | 65.2 /100 | #160 | Good 64.4% |