Immigrants from Guyana vs Blackfeet Currently Married

COMPARE

Immigrants from Guyana
Race
Ancestry
AfghanAfricanAlaska NativeAlaskan AthabascanAlbanianAleutAlsatianAmericanApacheArabArapahoArgentineanArmenianAssyrian/Chaldean/SyriacAustralianAustrianBahamianBangladeshiBarbadianBasqueBelgianBelizeanBermudanBhutaneseBolivianBrazilianBritishBritish West IndianBulgarianBurmeseCajunCambodianCanadianCape VerdeanCarpatho RusynCelticCentral AmericanCentral American IndianCherokeeCheyenneChickasawChileanChineseChippewaChoctawColombianColvilleComancheCosta RicanCreeCreekCroatianCrowCubanCypriotCzechCzechoslovakianDanishDelawareDominicanDutchDutch West IndianEastern EuropeanEcuadorianEgyptianEnglishEstonianEthiopianEuropeanFijianFilipinoFinnishFrenchFrench American IndianFrench CanadianGermanGerman RussianGhanaianGreekGuamanian/ChamorroGuatemalanGuyaneseHaitianHmongHonduranHopiHoumaHungarianIcelanderIndian (Asian)IndonesianInupiatIranianIraqiIrishIroquoisIsraeliItalianJamaicanJapaneseJordanianKenyanKiowaKoreanLaotianLatvianLebaneseLiberianLithuanianLumbeeLuxembourgerMacedonianMalaysianMalteseMarshalleseMenomineeMexicanMexican American IndianMongolianMoroccanNative HawaiianNavajoNepaleseNew ZealanderNicaraguanNigerianNorthern EuropeanNorwegianOkinawanOsageOttawaPaiutePakistaniPalestinianPanamanianParaguayanPennsylvania GermanPeruvianPimaPolishPortuguesePotawatomiPuebloPuerto RicanPuget Sound SalishRomanianRussianSalvadoranSamoanScandinavianScotch-IrishScottishSeminoleSenegaleseSerbianShoshoneSierra LeoneanSiouxSlavicSlovakSloveneSomaliSouth AfricanSouth AmericanSouth American IndianSoviet UnionSpaniardSpanishSpanish AmericanSpanish American IndianSri LankanSubsaharan AfricanSudaneseSwedishSwissSyrianTaiwaneseThaiTlingit-HaidaTohono O'OdhamTonganTrinidadian and TobagonianTsimshianTurkishU.S. Virgin IslanderUgandanUkrainianUruguayanUteVenezuelanVietnameseWelshWest IndianYakamaYaquiYugoslavianYumanYup'ikZimbabwean
Immigration
NonimmigrantsImmigrantsAfghanistanAfricaAlbaniaArgentinaArmeniaAsiaAustraliaAustriaBahamasBangladeshBarbadosBelarusBelgiumBelizeBoliviaBosnia and HerzegovinaBrazilBulgariaBurma/MyanmarCabo VerdeCambodiaCameroonCanadaCaribbeanCentral AmericaChileChinaColombiaCongoCosta RicaCroatiaCubaCzechoslovakiaDenmarkDominicaDominican RepublicEastern AfricaEastern AsiaEastern EuropeEcuadorEgyptEl SalvadorEnglandEritreaEthiopiaEuropeFijiFranceGermanyGhanaGreeceGrenadaGuatemalaGuyanaHaitiHondurasHong KongHungaryIndiaIndonesiaIranIraqIrelandIsraelItalyJamaicaJapanJordanKazakhstanKenyaKoreaKuwaitLaosLatin AmericaLatviaLebanonLiberiaLithuaniaMalaysiaMexicoMicronesiaMiddle AfricaMoldovaMoroccoNepalNetherlandsNicaraguaNigeriaNorth AmericaNorth MacedoniaNorthern AfricaNorthern EuropeNorwayOceaniaPakistanPanamaPeruPhilippinesPolandPortugalRomaniaRussiaSaudi ArabiaScotlandSenegalSerbiaSierra LeoneSingaporeSomaliaSouth AfricaSouth AmericaSouth Central AsiaSouth Eastern AsiaSouthern EuropeSpainSri LankaSt. Vincent and the GrenadinesSudanSwedenSwitzerlandSyriaTaiwanThailandTrinidad and TobagoTurkeyUgandaUkraineUruguayUzbekistanVenezuelaVietnamWest IndiesWestern AfricaWestern AsiaWestern EuropeYemenZaireZimbabweAzores
Blackfeet
Race
Ancestry
AfghanAfricanAlaska NativeAlaskan AthabascanAlbanianAleutAlsatianAmericanApacheArabArapahoArgentineanArmenianAssyrian/Chaldean/SyriacAustralianAustrianBahamianBangladeshiBarbadianBasqueBelgianBelizeanBermudanBhutaneseBlackfeetBolivianBrazilianBritishBritish West IndianBulgarianBurmeseCajunCambodianCanadianCape VerdeanCarpatho RusynCelticCentral AmericanCentral American IndianCherokeeCheyenneChickasawChileanChineseChippewaChoctawColombianColvilleComancheCosta RicanCreeCreekCroatianCrowCubanCypriotCzechCzechoslovakianDanishDelawareDominicanDutchDutch West IndianEastern EuropeanEcuadorianEgyptianEnglishEstonianEthiopianEuropeanFijianFilipinoFinnishFrenchFrench American IndianFrench CanadianGermanGerman RussianGhanaianGreekGuamanian/ChamorroGuatemalanGuyaneseHaitianHmongHonduranHopiHoumaHungarianIcelanderIndian (Asian)IndonesianInupiatIranianIraqiIrishIroquoisIsraeliItalianJamaicanJapaneseJordanianKenyanKiowaKoreanLaotianLatvianLebaneseLiberianLithuanianLumbeeLuxembourgerMacedonianMalaysianMalteseMarshalleseMenomineeMexicanMexican American IndianMongolianMoroccanNative HawaiianNavajoNepaleseNew ZealanderNicaraguanNigerianNorthern EuropeanNorwegianOkinawanOsageOttawaPaiutePakistaniPalestinianPanamanianParaguayanPennsylvania GermanPeruvianPimaPolishPortuguesePotawatomiPuebloPuerto RicanPuget Sound SalishRomanianRussianSalvadoranSamoanScandinavianScotch-IrishScottishSeminoleSenegaleseSerbianShoshoneSierra LeoneanSiouxSlavicSlovakSloveneSomaliSouth AfricanSouth AmericanSouth American IndianSoviet UnionSpaniardSpanishSpanish AmericanSpanish American IndianSri LankanSubsaharan AfricanSudaneseSwedishSwissSyrianTaiwaneseThaiTlingit-HaidaTohono O'OdhamTonganTrinidadian and TobagonianTsimshianTurkishU.S. Virgin IslanderUgandanUkrainianUruguayanUteVenezuelanVietnameseWelshWest IndianYakamaYaquiYugoslavianYumanYup'ikZimbabwean
Immigration
NonimmigrantsImmigrantsAfghanistanAfricaAlbaniaArgentinaArmeniaAsiaAustraliaAustriaBahamasBangladeshBarbadosBelarusBelgiumBelizeBoliviaBosnia and HerzegovinaBrazilBulgariaBurma/MyanmarCabo VerdeCambodiaCameroonCanadaCaribbeanCentral AmericaChileChinaColombiaCongoCosta RicaCroatiaCubaCzechoslovakiaDenmarkDominicaDominican RepublicEastern AfricaEastern AsiaEastern EuropeEcuadorEgyptEl SalvadorEnglandEritreaEthiopiaEuropeFijiFranceGermanyGhanaGreeceGrenadaGuatemalaHaitiHondurasHong KongHungaryIndiaIndonesiaIranIraqIrelandIsraelItalyJamaicaJapanJordanKazakhstanKenyaKoreaKuwaitLaosLatin AmericaLatviaLebanonLiberiaLithuaniaMalaysiaMexicoMicronesiaMiddle AfricaMoldovaMoroccoNepalNetherlandsNicaraguaNigeriaNorth AmericaNorth MacedoniaNorthern AfricaNorthern EuropeNorwayOceaniaPakistanPanamaPeruPhilippinesPolandPortugalRomaniaRussiaSaudi ArabiaScotlandSenegalSerbiaSierra LeoneSingaporeSomaliaSouth AfricaSouth AmericaSouth Central AsiaSouth Eastern AsiaSouthern EuropeSpainSri LankaSt. Vincent and the GrenadinesSudanSwedenSwitzerlandSyriaTaiwanThailandTrinidad and TobagoTurkeyUgandaUkraineUruguayUzbekistanVenezuelaVietnamWest IndiesWestern AfricaWestern AsiaWestern EuropeYemenZaireZimbabweAzores
Currently Married
Income
Poverty
Unemployment
Labor Participation
Family Structure
Vehicle Availability
Education Level
Disability

Currently Married Comparison

Immigrants from Guyana

Blackfeet

Tragic
Tragic
41.9%
CURRENTLY MARRIED
0.0/ 100
METRIC RATING
306th/ 347
METRIC RANK
44.2%
CURRENTLY MARRIED
0.3/ 100
METRIC RATING
251st/ 347
METRIC RANK

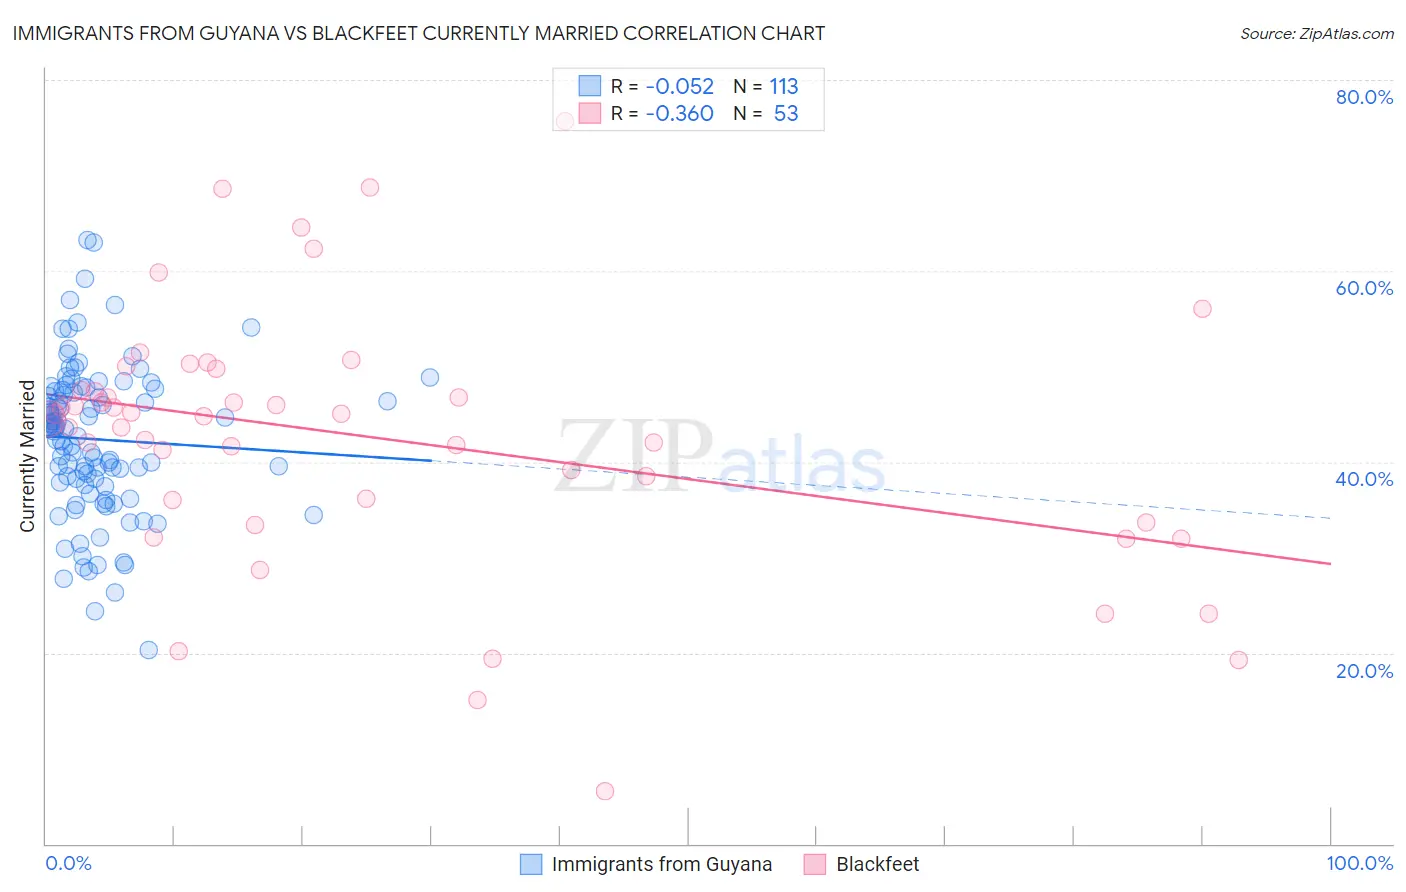
Immigrants from Guyana vs Blackfeet Currently Married Correlation Chart

The statistical analysis conducted on geographies consisting of 183,739,040 people shows a slight negative correlation between the proportion of Immigrants from Guyana and percentage of population currently married in the United States with a correlation coefficient (R) of -0.052 and weighted average of 41.9%. Similarly, the statistical analysis conducted on geographies consisting of 309,564,713 people shows a mild negative correlation between the proportion of Blackfeet and percentage of population currently married in the United States with a correlation coefficient (R) of -0.360 and weighted average of 44.2%, a difference of 5.4%.
Immigrants from Guyana vs Blackfeet Currently Married

Currently Married Correlation Summary

MeasurementImmigrants from GuyanaBlackfeet
Minimum20.3%5.5%
Maximum63.3%75.7%
Range43.0%70.2%
Mean42.4%42.5%
Median43.5%44.8%
Interquartile 25% (IQ1)37.7%34.9%
Interquartile 75% (IQ3)47.5%48.6%
Interquartile Range (IQR)9.8%13.7%
Standard Deviation (Sample)7.9%13.6%
Standard Deviation (Population)7.8%13.4%

Similar Demographics by Currently Married

Demographics Similar to Immigrants from Guyana by Currently Married

In terms of currently married, the demographic groups most similar to Immigrants from Guyana are Immigrants from Trinidad and Tobago (41.9%, a difference of 0.010%), Immigrants from Bahamas (41.9%, a difference of 0.040%), African (41.8%, a difference of 0.13%), Sioux (41.9%, a difference of 0.16%), and Immigrants from Zaire (42.0%, a difference of 0.17%).
DemographicsRating | RankCurrently Married
Liberians
0.0
/100
|
#299
Tragic
42.2%
Belizeans
0.0
/100
|
#300
Tragic
42.2%
Immigrants | Yemen
0.0
/100
|
#301
Tragic
42.1%
Immigrants | Zaire
0.0
/100
|
#302
Tragic
42.0%
Sioux
0.0
/100
|
#303
Tragic
41.9%
Immigrants | Bahamas
0.0
/100
|
#304
Tragic
41.9%
Immigrants | Trinidad and Tobago
0.0
/100
|
#305
Tragic
41.9%
Immigrants | Guyana
0.0
/100
|
#306
Tragic
41.9%
Africans
0.0
/100
|
#307
Tragic
41.8%
Immigrants | Belize
0.0
/100
|
#308
Tragic
41.8%
Immigrants | Liberia
0.0
/100
|
#309
Tragic
41.8%
Guyanese
0.0
/100
|
#310
Tragic
41.6%
Trinidadians and Tobagonians
0.0
/100
|
#311
Tragic
41.5%
Somalis
0.0
/100
|
#312
Tragic
41.5%
Jamaicans
0.0
/100
|
#313
Tragic
41.4%

Demographics Similar to Blackfeet by Currently Married

In terms of currently married, the demographic groups most similar to Blackfeet are Hispanic or Latino (44.1%, a difference of 0.020%), Immigrants from Central America (44.1%, a difference of 0.050%), Immigrants from Eastern Africa (44.2%, a difference of 0.060%), Immigrants from Cameroon (44.2%, a difference of 0.080%), and Nicaraguan (44.2%, a difference of 0.10%).
DemographicsRating | RankCurrently Married
Japanese
0.6
/100
|
#244
Tragic
44.5%
Immigrants | Armenia
0.4
/100
|
#245
Tragic
44.3%
Immigrants | Burma/Myanmar
0.4
/100
|
#246
Tragic
44.3%
Ugandans
0.4
/100
|
#247
Tragic
44.2%
Nicaraguans
0.3
/100
|
#248
Tragic
44.2%
Immigrants | Cameroon
0.3
/100
|
#249
Tragic
44.2%
Immigrants | Eastern Africa
0.3
/100
|
#250
Tragic
44.2%
Blackfeet
0.3
/100
|
#251
Tragic
44.2%
Hispanics or Latinos
0.3
/100
|
#252
Tragic
44.1%
Immigrants | Central America
0.3
/100
|
#253
Tragic
44.1%
Vietnamese
0.2
/100
|
#254
Tragic
44.0%
Yakama
0.2
/100
|
#255
Tragic
44.0%
Shoshone
0.2
/100
|
#256
Tragic
44.0%
Immigrants | Africa
0.2
/100
|
#257
Tragic
43.9%
Ute
0.2
/100
|
#258
Tragic
43.9%