French American Indian vs Australian Births to Unmarried Women
COMPARE
French American Indian
Australian
Births to Unmarried Women
Births to Unmarried Women Comparison
French American Indians
Australians
36.6%
BIRTHS TO UNMARRIED WOMEN
0.1/ 100
METRIC RATING
262nd/ 347
METRIC RANK
29.5%
BIRTHS TO UNMARRIED WOMEN
94.6/ 100
METRIC RATING
102nd/ 347
METRIC RANK
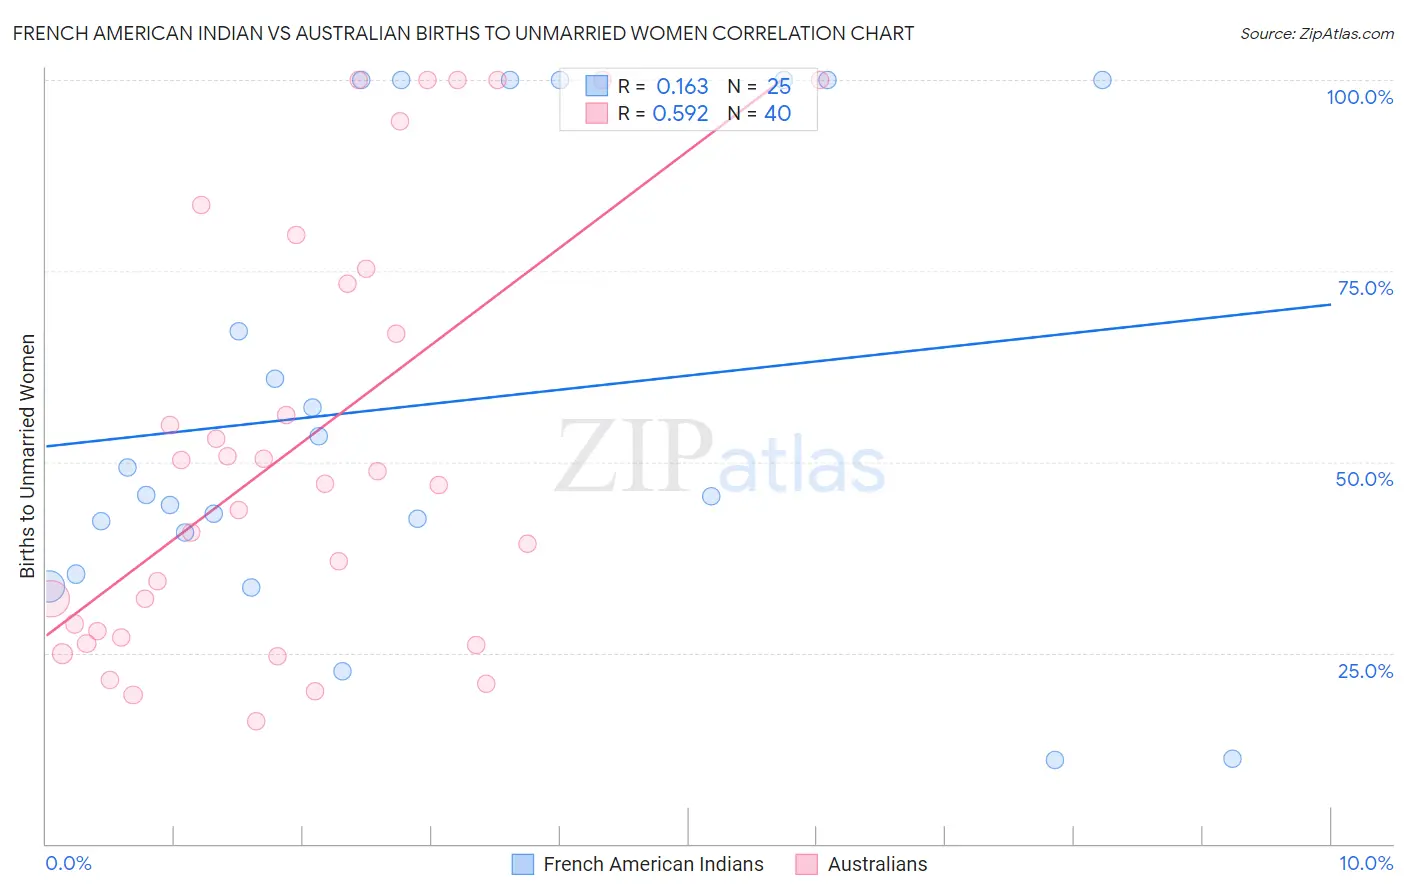
French American Indian vs Australian Births to Unmarried Women Correlation Chart
The statistical analysis conducted on geographies consisting of 128,368,933 people shows a poor positive correlation between the proportion of French American Indians and percentage of births to unmarried women in the United States with a correlation coefficient (R) of 0.163 and weighted average of 36.6%. Similarly, the statistical analysis conducted on geographies consisting of 212,996,225 people shows a substantial positive correlation between the proportion of Australians and percentage of births to unmarried women in the United States with a correlation coefficient (R) of 0.592 and weighted average of 29.5%, a difference of 23.9%.
Births to Unmarried Women Correlation Summary
| Measurement | French American Indian | Australian |
| Minimum | 10.9% | 16.0% |
| Maximum | 100.0% | 100.0% |
| Range | 89.1% | 84.0% |
| Mean | 57.6% | 51.9% |
| Median | 45.7% | 47.1% |
| Interquartile 25% (IQ1) | 38.0% | 27.4% |
| Interquartile 75% (IQ3) | 100.0% | 74.3% |
| Interquartile Range (IQR) | 62.0% | 46.9% |
| Standard Deviation (Sample) | 29.9% | 27.9% |
| Standard Deviation (Population) | 29.3% | 27.5% |
Similar Demographics by Births to Unmarried Women
Demographics Similar to French American Indians by Births to Unmarried Women
In terms of births to unmarried women, the demographic groups most similar to French American Indians are Nicaraguan (36.6%, a difference of 0.020%), Subsaharan African (36.7%, a difference of 0.14%), Cherokee (36.7%, a difference of 0.19%), Immigrants from Senegal (36.7%, a difference of 0.24%), and Central American (36.7%, a difference of 0.31%).
| Demographics | Rating | Rank | Births to Unmarried Women |
| Chickasaw | 0.2 /100 | #255 | Tragic 36.3% |
| Immigrants | Trinidad and Tobago | 0.2 /100 | #256 | Tragic 36.3% |
| Immigrants | Grenada | 0.2 /100 | #257 | Tragic 36.3% |
| Americans | 0.2 /100 | #258 | Tragic 36.4% |
| Immigrants | El Salvador | 0.2 /100 | #259 | Tragic 36.4% |
| Ottawa | 0.2 /100 | #260 | Tragic 36.5% |
| Trinidadians and Tobagonians | 0.2 /100 | #261 | Tragic 36.5% |
| French American Indians | 0.1 /100 | #262 | Tragic 36.6% |
| Nicaraguans | 0.1 /100 | #263 | Tragic 36.6% |
| Sub-Saharan Africans | 0.1 /100 | #264 | Tragic 36.7% |
| Cherokee | 0.1 /100 | #265 | Tragic 36.7% |
| Immigrants | Senegal | 0.1 /100 | #266 | Tragic 36.7% |
| Central Americans | 0.1 /100 | #267 | Tragic 36.7% |
| Comanche | 0.1 /100 | #268 | Tragic 36.7% |
| Senegalese | 0.1 /100 | #269 | Tragic 36.8% |
Demographics Similar to Australians by Births to Unmarried Women
In terms of births to unmarried women, the demographic groups most similar to Australians are Lebanese (29.5%, a difference of 0.050%), Lithuanian (29.6%, a difference of 0.060%), Immigrants from Northern Africa (29.5%, a difference of 0.080%), Immigrants from Nepal (29.6%, a difference of 0.11%), and Immigrants from Denmark (29.4%, a difference of 0.37%).
| Demographics | Rating | Rank | Births to Unmarried Women |
| Immigrants | Vietnam | 96.1 /100 | #95 | Exceptional 29.3% |
| Norwegians | 95.8 /100 | #96 | Exceptional 29.3% |
| Immigrants | South Africa | 95.7 /100 | #97 | Exceptional 29.3% |
| Immigrants | Syria | 95.7 /100 | #98 | Exceptional 29.4% |
| Immigrants | Denmark | 95.3 /100 | #99 | Exceptional 29.4% |
| Luxembourgers | 95.2 /100 | #100 | Exceptional 29.4% |
| Immigrants | Northern Africa | 94.7 /100 | #101 | Exceptional 29.5% |
| Australians | 94.6 /100 | #102 | Exceptional 29.5% |
| Lebanese | 94.4 /100 | #103 | Exceptional 29.5% |
| Lithuanians | 94.4 /100 | #104 | Exceptional 29.6% |
| Immigrants | Nepal | 94.3 /100 | #105 | Exceptional 29.6% |
| Swedes | 93.8 /100 | #106 | Exceptional 29.6% |
| Immigrants | Brazil | 93.7 /100 | #107 | Exceptional 29.6% |
| Paraguayans | 93.5 /100 | #108 | Exceptional 29.7% |
| Greeks | 93.4 /100 | #109 | Exceptional 29.7% |