Immigrants from Scotland vs Australian Births to Unmarried Women
COMPARE
Immigrants from Scotland
Australian
Births to Unmarried Women
Births to Unmarried Women Comparison
Immigrants from Scotland
Australians
30.4%
BIRTHS TO UNMARRIED WOMEN
84.6/ 100
METRIC RATING
136th/ 347
METRIC RANK
29.5%
BIRTHS TO UNMARRIED WOMEN
94.6/ 100
METRIC RATING
102nd/ 347
METRIC RANK
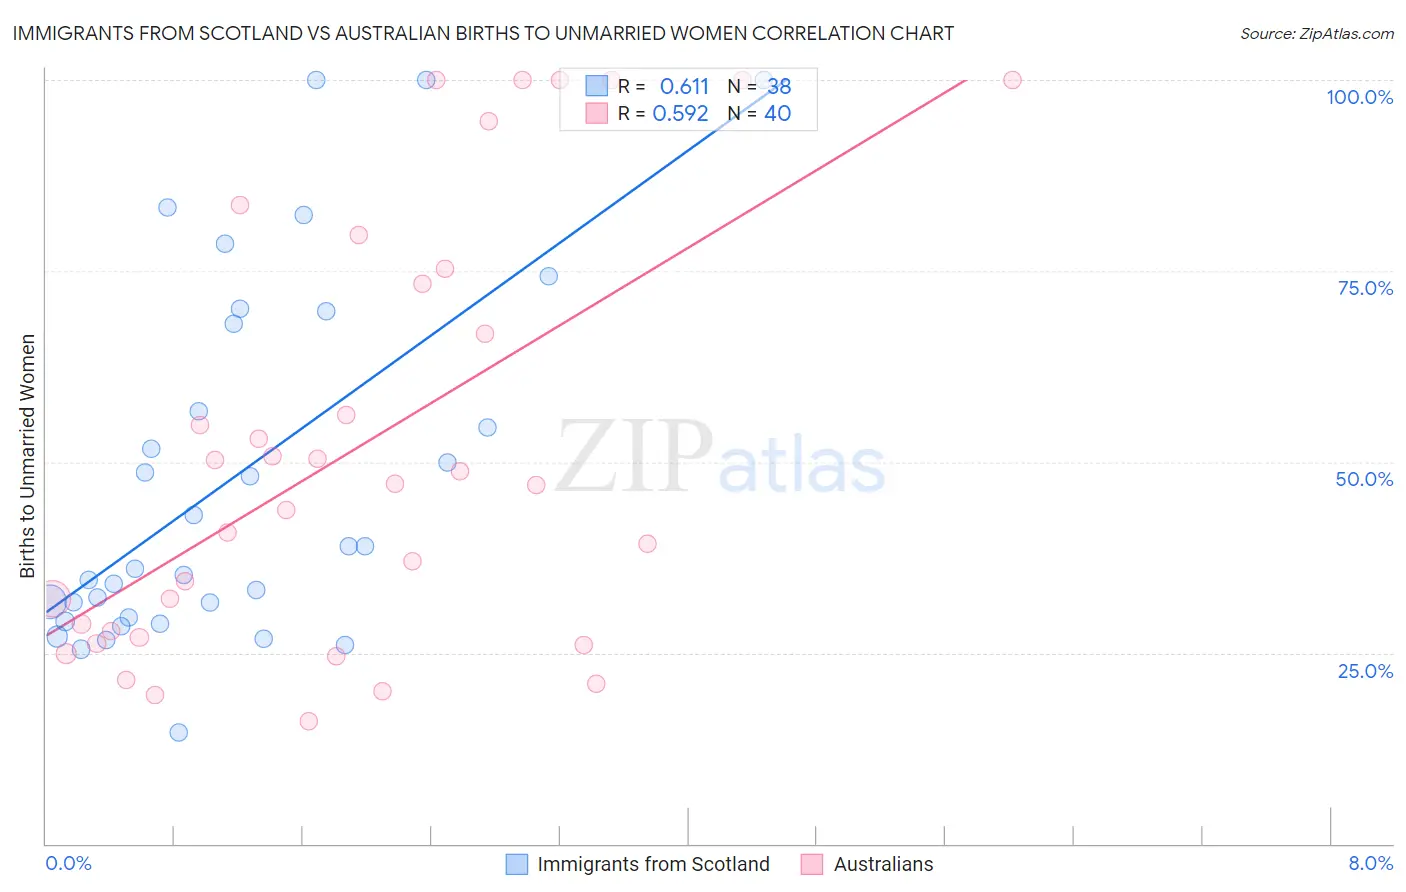
Immigrants from Scotland vs Australian Births to Unmarried Women Correlation Chart
The statistical analysis conducted on geographies consisting of 185,682,115 people shows a significant positive correlation between the proportion of Immigrants from Scotland and percentage of births to unmarried women in the United States with a correlation coefficient (R) of 0.611 and weighted average of 30.4%. Similarly, the statistical analysis conducted on geographies consisting of 212,996,225 people shows a substantial positive correlation between the proportion of Australians and percentage of births to unmarried women in the United States with a correlation coefficient (R) of 0.592 and weighted average of 29.5%, a difference of 2.9%.
Births to Unmarried Women Correlation Summary
| Measurement | Immigrants from Scotland | Australian |
| Minimum | 14.6% | 16.0% |
| Maximum | 100.0% | 100.0% |
| Range | 85.4% | 84.0% |
| Mean | 47.9% | 51.9% |
| Median | 37.5% | 47.1% |
| Interquartile 25% (IQ1) | 29.6% | 27.4% |
| Interquartile 75% (IQ3) | 68.2% | 74.3% |
| Interquartile Range (IQR) | 38.6% | 46.9% |
| Standard Deviation (Sample) | 23.6% | 27.9% |
| Standard Deviation (Population) | 23.3% | 27.5% |
Similar Demographics by Births to Unmarried Women
Demographics Similar to Immigrants from Scotland by Births to Unmarried Women
In terms of births to unmarried women, the demographic groups most similar to Immigrants from Scotland are Brazilian (30.4%, a difference of 0.030%), Immigrants from South Eastern Asia (30.4%, a difference of 0.11%), Immigrants from Morocco (30.4%, a difference of 0.12%), Immigrants from Philippines (30.4%, a difference of 0.13%), and Puget Sound Salish (30.4%, a difference of 0.13%).
| Demographics | Rating | Rank | Births to Unmarried Women |
| Immigrants | Spain | 85.8 /100 | #129 | Excellent 30.3% |
| Immigrants | Bosnia and Herzegovina | 85.7 /100 | #130 | Excellent 30.3% |
| Immigrants | Zimbabwe | 85.7 /100 | #131 | Excellent 30.3% |
| New Zealanders | 85.5 /100 | #132 | Excellent 30.3% |
| Immigrants | Morocco | 85.2 /100 | #133 | Excellent 30.4% |
| Immigrants | South Eastern Asia | 85.2 /100 | #134 | Excellent 30.4% |
| Brazilians | 84.8 /100 | #135 | Excellent 30.4% |
| Immigrants | Scotland | 84.6 /100 | #136 | Excellent 30.4% |
| Immigrants | Philippines | 83.9 /100 | #137 | Excellent 30.4% |
| Puget Sound Salish | 83.9 /100 | #138 | Excellent 30.4% |
| Immigrants | Canada | 83.7 /100 | #139 | Excellent 30.4% |
| Swiss | 83.1 /100 | #140 | Excellent 30.5% |
| Pakistanis | 83.0 /100 | #141 | Excellent 30.5% |
| South Africans | 82.7 /100 | #142 | Excellent 30.5% |
| Immigrants | Uganda | 82.6 /100 | #143 | Excellent 30.5% |
Demographics Similar to Australians by Births to Unmarried Women
In terms of births to unmarried women, the demographic groups most similar to Australians are Lebanese (29.5%, a difference of 0.050%), Lithuanian (29.6%, a difference of 0.060%), Immigrants from Northern Africa (29.5%, a difference of 0.080%), Immigrants from Nepal (29.6%, a difference of 0.11%), and Immigrants from Denmark (29.4%, a difference of 0.37%).
| Demographics | Rating | Rank | Births to Unmarried Women |
| Immigrants | Vietnam | 96.1 /100 | #95 | Exceptional 29.3% |
| Norwegians | 95.8 /100 | #96 | Exceptional 29.3% |
| Immigrants | South Africa | 95.7 /100 | #97 | Exceptional 29.3% |
| Immigrants | Syria | 95.7 /100 | #98 | Exceptional 29.4% |
| Immigrants | Denmark | 95.3 /100 | #99 | Exceptional 29.4% |
| Luxembourgers | 95.2 /100 | #100 | Exceptional 29.4% |
| Immigrants | Northern Africa | 94.7 /100 | #101 | Exceptional 29.5% |
| Australians | 94.6 /100 | #102 | Exceptional 29.5% |
| Lebanese | 94.4 /100 | #103 | Exceptional 29.5% |
| Lithuanians | 94.4 /100 | #104 | Exceptional 29.6% |
| Immigrants | Nepal | 94.3 /100 | #105 | Exceptional 29.6% |
| Swedes | 93.8 /100 | #106 | Exceptional 29.6% |
| Immigrants | Brazil | 93.7 /100 | #107 | Exceptional 29.6% |
| Paraguayans | 93.5 /100 | #108 | Exceptional 29.7% |
| Greeks | 93.4 /100 | #109 | Exceptional 29.7% |