Immigrants from Guatemala vs Austrian Married-couple Households
COMPARE
Immigrants from Guatemala
Austrian
Married-couple Households
Married-couple Households Comparison
Immigrants from Guatemala
Austrians
42.8%
MARRIED-COUPLE HOUSEHOLDS
0.0/ 100
METRIC RATING
281st/ 347
METRIC RANK
48.6%
MARRIED-COUPLE HOUSEHOLDS
99.3/ 100
METRIC RATING
55th/ 347
METRIC RANK
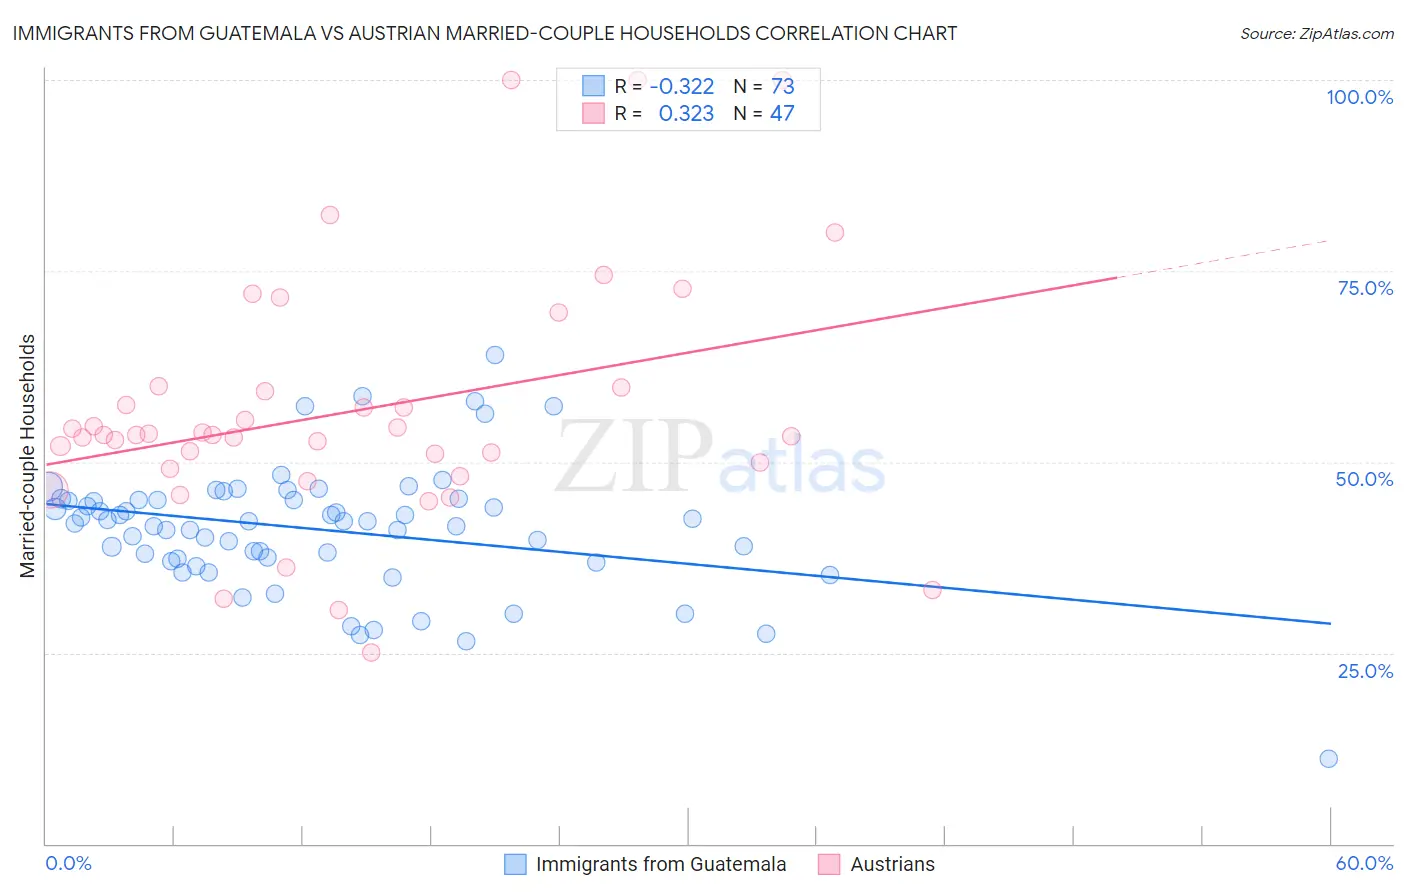
Immigrants from Guatemala vs Austrian Married-couple Households Correlation Chart
The statistical analysis conducted on geographies consisting of 377,166,435 people shows a mild negative correlation between the proportion of Immigrants from Guatemala and percentage of married-couple family households in the United States with a correlation coefficient (R) of -0.322 and weighted average of 42.8%. Similarly, the statistical analysis conducted on geographies consisting of 451,781,839 people shows a mild positive correlation between the proportion of Austrians and percentage of married-couple family households in the United States with a correlation coefficient (R) of 0.323 and weighted average of 48.6%, a difference of 13.5%.
Married-couple Households Correlation Summary
| Measurement | Immigrants from Guatemala | Austrian |
| Minimum | 11.2% | 25.0% |
| Maximum | 64.0% | 100.0% |
| Range | 52.8% | 75.0% |
| Mean | 41.1% | 56.7% |
| Median | 42.2% | 53.5% |
| Interquartile 25% (IQ1) | 37.2% | 49.2% |
| Interquartile 75% (IQ3) | 45.0% | 59.8% |
| Interquartile Range (IQR) | 7.9% | 10.6% |
| Standard Deviation (Sample) | 8.3% | 16.4% |
| Standard Deviation (Population) | 8.2% | 16.2% |
Similar Demographics by Married-couple Households
Demographics Similar to Immigrants from Guatemala by Married-couple Households
In terms of married-couple households, the demographic groups most similar to Immigrants from Guatemala are Immigrants from Ecuador (42.9%, a difference of 0.070%), Sierra Leonean (42.9%, a difference of 0.13%), Immigrants from Africa (42.9%, a difference of 0.16%), Immigrants from Eastern Africa (42.9%, a difference of 0.26%), and Immigrants from Ethiopia (43.1%, a difference of 0.52%).
| Demographics | Rating | Rank | Married-couple Households |
| Nigerians | 0.1 /100 | #274 | Tragic 43.2% |
| Immigrants | Bangladesh | 0.0 /100 | #275 | Tragic 43.1% |
| Immigrants | Ethiopia | 0.0 /100 | #276 | Tragic 43.1% |
| Immigrants | Eastern Africa | 0.0 /100 | #277 | Tragic 42.9% |
| Immigrants | Africa | 0.0 /100 | #278 | Tragic 42.9% |
| Sierra Leoneans | 0.0 /100 | #279 | Tragic 42.9% |
| Immigrants | Ecuador | 0.0 /100 | #280 | Tragic 42.9% |
| Immigrants | Guatemala | 0.0 /100 | #281 | Tragic 42.8% |
| Bermudans | 0.0 /100 | #282 | Tragic 42.4% |
| Inupiat | 0.0 /100 | #283 | Tragic 42.4% |
| Cheyenne | 0.0 /100 | #284 | Tragic 42.3% |
| Ghanaians | 0.0 /100 | #285 | Tragic 42.2% |
| Belizeans | 0.0 /100 | #286 | Tragic 42.2% |
| Chippewa | 0.0 /100 | #287 | Tragic 42.1% |
| Immigrants | Eritrea | 0.0 /100 | #288 | Tragic 42.1% |
Demographics Similar to Austrians by Married-couple Households
In terms of married-couple households, the demographic groups most similar to Austrians are Immigrants from Northern Europe (48.6%, a difference of 0.0%), White/Caucasian (48.6%, a difference of 0.010%), Immigrants from Lithuania (48.6%, a difference of 0.010%), Irish (48.6%, a difference of 0.060%), and Polish (48.5%, a difference of 0.090%).
| Demographics | Rating | Rank | Married-couple Households |
| Indians (Asian) | 99.4 /100 | #48 | Exceptional 48.7% |
| Immigrants | Sri Lanka | 99.4 /100 | #49 | Exceptional 48.7% |
| Samoans | 99.4 /100 | #50 | Exceptional 48.7% |
| Eastern Europeans | 99.3 /100 | #51 | Exceptional 48.6% |
| Irish | 99.3 /100 | #52 | Exceptional 48.6% |
| Whites/Caucasians | 99.3 /100 | #53 | Exceptional 48.6% |
| Immigrants | Lithuania | 99.3 /100 | #54 | Exceptional 48.6% |
| Austrians | 99.3 /100 | #55 | Exceptional 48.6% |
| Immigrants | Northern Europe | 99.3 /100 | #56 | Exceptional 48.6% |
| Poles | 99.2 /100 | #57 | Exceptional 48.5% |
| Immigrants | Indonesia | 99.2 /100 | #58 | Exceptional 48.5% |
| Czechoslovakians | 99.2 /100 | #59 | Exceptional 48.5% |
| Croatians | 99.1 /100 | #60 | Exceptional 48.5% |
| Bulgarians | 99.1 /100 | #61 | Exceptional 48.5% |
| Luxembourgers | 99.1 /100 | #62 | Exceptional 48.5% |