Immigrants from Grenada vs Immigrants from Russia Single Father Households
COMPARE
Immigrants from Grenada
Immigrants from Russia
Single Father Households
Single Father Households Comparison
Immigrants from Grenada
Immigrants from Russia
2.0%
SINGLE FATHER HOUSEHOLDS
100.0/ 100
METRIC RATING
43rd/ 347
METRIC RANK
2.0%
SINGLE FATHER HOUSEHOLDS
100.0/ 100
METRIC RATING
24th/ 347
METRIC RANK
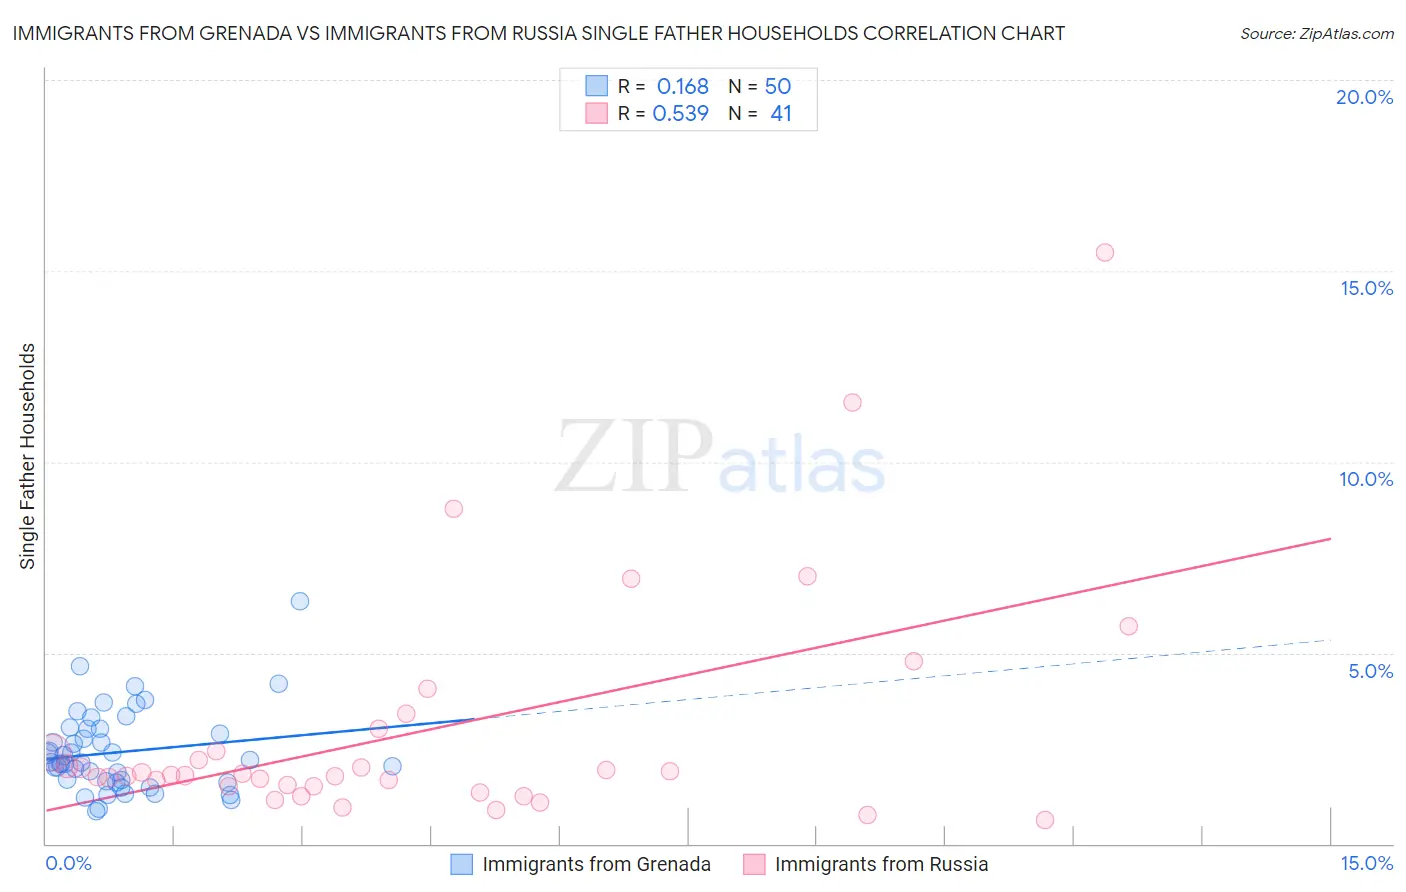
Immigrants from Grenada vs Immigrants from Russia Single Father Households Correlation Chart
The statistical analysis conducted on geographies consisting of 67,096,407 people shows a poor positive correlation between the proportion of Immigrants from Grenada and percentage of single father households in the United States with a correlation coefficient (R) of 0.168 and weighted average of 2.0%. Similarly, the statistical analysis conducted on geographies consisting of 345,238,184 people shows a substantial positive correlation between the proportion of Immigrants from Russia and percentage of single father households in the United States with a correlation coefficient (R) of 0.539 and weighted average of 2.0%, a difference of 2.4%.
Single Father Households Correlation Summary
| Measurement | Immigrants from Grenada | Immigrants from Russia |
| Minimum | 0.86% | 0.62% |
| Maximum | 6.4% | 15.5% |
| Range | 5.5% | 14.8% |
| Mean | 2.4% | 2.9% |
| Median | 2.1% | 1.8% |
| Interquartile 25% (IQ1) | 1.6% | 1.5% |
| Interquartile 75% (IQ3) | 3.0% | 2.7% |
| Interquartile Range (IQR) | 1.3% | 1.2% |
| Standard Deviation (Sample) | 1.1% | 3.0% |
| Standard Deviation (Population) | 1.0% | 3.0% |
Demographics Similar to Immigrants from Grenada and Immigrants from Russia by Single Father Households
In terms of single father households, the demographic groups most similar to Immigrants from Grenada are Macedonian (2.0%, a difference of 0.23%), Immigrants from Turkey (2.0%, a difference of 0.38%), Immigrants from Bulgaria (2.0%, a difference of 0.56%), Immigrants from Eastern Europe (2.0%, a difference of 0.61%), and Immigrants from Sri Lanka (2.0%, a difference of 0.61%). Similarly, the demographic groups most similar to Immigrants from Russia are Immigrants from Croatia (2.0%, a difference of 0.0%), Eastern European (2.0%, a difference of 0.0%), Assyrian/Chaldean/Syriac (2.0%, a difference of 0.15%), Immigrants from South Central Asia (2.0%, a difference of 0.43%), and Immigrants from Japan (2.0%, a difference of 0.61%).
| Demographics | Rating | Rank | Single Father Households |
| Immigrants | Croatia | 100.0 /100 | #23 | Exceptional 2.0% |
| Immigrants | Russia | 100.0 /100 | #24 | Exceptional 2.0% |
| Eastern Europeans | 100.0 /100 | #25 | Exceptional 2.0% |
| Assyrians/Chaldeans/Syriacs | 100.0 /100 | #26 | Exceptional 2.0% |
| Immigrants | South Central Asia | 100.0 /100 | #27 | Exceptional 2.0% |
| Immigrants | Japan | 100.0 /100 | #28 | Exceptional 2.0% |
| Bulgarians | 100.0 /100 | #29 | Exceptional 2.0% |
| Cambodians | 100.0 /100 | #30 | Exceptional 2.0% |
| Israelis | 100.0 /100 | #31 | Exceptional 2.0% |
| Chinese | 100.0 /100 | #32 | Exceptional 2.0% |
| Turks | 100.0 /100 | #33 | Exceptional 2.0% |
| Immigrants | Australia | 100.0 /100 | #34 | Exceptional 2.0% |
| Albanians | 100.0 /100 | #35 | Exceptional 2.0% |
| Immigrants | Belgium | 100.0 /100 | #36 | Exceptional 2.0% |
| Immigrants | St. Vincent and the Grenadines | 100.0 /100 | #37 | Exceptional 2.0% |
| Immigrants | Eastern Europe | 100.0 /100 | #38 | Exceptional 2.0% |
| Immigrants | Sri Lanka | 100.0 /100 | #39 | Exceptional 2.0% |
| Immigrants | Bulgaria | 100.0 /100 | #40 | Exceptional 2.0% |
| Immigrants | Turkey | 100.0 /100 | #41 | Exceptional 2.0% |
| Macedonians | 100.0 /100 | #42 | Exceptional 2.0% |
| Immigrants | Grenada | 100.0 /100 | #43 | Exceptional 2.0% |