Immigrants from Greece vs Immigrants from Afghanistan Family Households with Children
COMPARE
Immigrants from Greece
Immigrants from Afghanistan
Family Households with Children
Family Households with Children Comparison
Immigrants from Greece
Immigrants from Afghanistan
26.0%
FAMILY HOUSEHOLDS WITH CHILDREN
0.0/ 100
METRIC RATING
322nd/ 347
METRIC RANK
30.0%
FAMILY HOUSEHOLDS WITH CHILDREN
100.0/ 100
METRIC RATING
16th/ 347
METRIC RANK
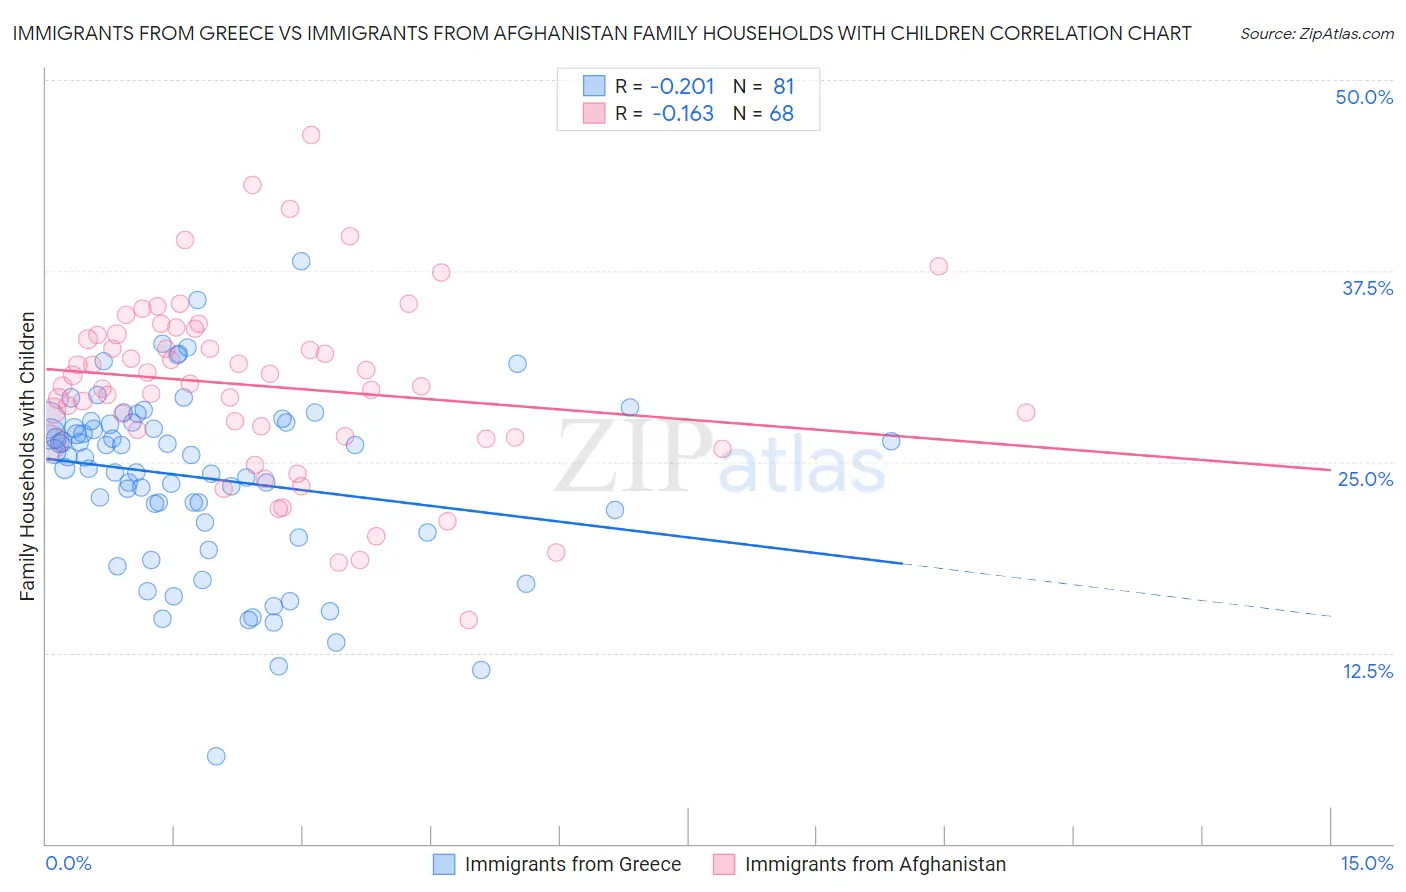
Immigrants from Greece vs Immigrants from Afghanistan Family Households with Children Correlation Chart
The statistical analysis conducted on geographies consisting of 216,757,437 people shows a weak negative correlation between the proportion of Immigrants from Greece and percentage of family households with children in the United States with a correlation coefficient (R) of -0.201 and weighted average of 26.0%. Similarly, the statistical analysis conducted on geographies consisting of 147,603,261 people shows a poor negative correlation between the proportion of Immigrants from Afghanistan and percentage of family households with children in the United States with a correlation coefficient (R) of -0.163 and weighted average of 30.0%, a difference of 15.4%.
Family Households with Children Correlation Summary
| Measurement | Immigrants from Greece | Immigrants from Afghanistan |
| Minimum | 5.8% | 14.7% |
| Maximum | 38.1% | 46.4% |
| Range | 32.4% | 31.7% |
| Mean | 24.0% | 30.0% |
| Median | 25.4% | 30.1% |
| Interquartile 25% (IQ1) | 20.7% | 26.6% |
| Interquartile 75% (IQ3) | 27.6% | 33.3% |
| Interquartile Range (IQR) | 6.9% | 6.7% |
| Standard Deviation (Sample) | 5.9% | 5.9% |
| Standard Deviation (Population) | 5.9% | 5.9% |
Similar Demographics by Family Households with Children
Demographics Similar to Immigrants from Greece by Family Households with Children
In terms of family households with children, the demographic groups most similar to Immigrants from Greece are British West Indian (26.0%, a difference of 0.010%), Tlingit-Haida (26.0%, a difference of 0.030%), Immigrants from Australia (26.0%, a difference of 0.030%), Immigrants from France (26.0%, a difference of 0.040%), and Chinese (26.0%, a difference of 0.070%).
| Demographics | Rating | Rank | Family Households with Children |
| Immigrants | Norway | 0.0 /100 | #315 | Tragic 26.1% |
| Estonians | 0.0 /100 | #316 | Tragic 26.1% |
| Ottawa | 0.0 /100 | #317 | Tragic 26.1% |
| Iroquois | 0.0 /100 | #318 | Tragic 26.1% |
| Immigrants | France | 0.0 /100 | #319 | Tragic 26.0% |
| Tlingit-Haida | 0.0 /100 | #320 | Tragic 26.0% |
| British West Indians | 0.0 /100 | #321 | Tragic 26.0% |
| Immigrants | Greece | 0.0 /100 | #322 | Tragic 26.0% |
| Immigrants | Australia | 0.0 /100 | #323 | Tragic 26.0% |
| Chinese | 0.0 /100 | #324 | Tragic 26.0% |
| Barbadians | 0.0 /100 | #325 | Tragic 26.0% |
| Immigrants | Ireland | 0.0 /100 | #326 | Tragic 26.0% |
| Immigrants | Barbados | 0.0 /100 | #327 | Tragic 26.0% |
| Immigrants | Albania | 0.0 /100 | #328 | Tragic 25.9% |
| Cypriots | 0.0 /100 | #329 | Tragic 25.9% |
Demographics Similar to Immigrants from Afghanistan by Family Households with Children
In terms of family households with children, the demographic groups most similar to Immigrants from Afghanistan are Immigrants from South Central Asia (30.0%, a difference of 0.020%), Bangladeshi (30.1%, a difference of 0.20%), Hispanic or Latino (29.9%, a difference of 0.39%), Afghan (30.2%, a difference of 0.48%), and Salvadoran (29.9%, a difference of 0.57%).
| Demographics | Rating | Rank | Family Households with Children |
| Thais | 100.0 /100 | #9 | Exceptional 30.6% |
| Immigrants | Fiji | 100.0 /100 | #10 | Exceptional 30.5% |
| Nepalese | 100.0 /100 | #11 | Exceptional 30.5% |
| Immigrants | Pakistan | 100.0 /100 | #12 | Exceptional 30.2% |
| Afghans | 100.0 /100 | #13 | Exceptional 30.2% |
| Bangladeshis | 100.0 /100 | #14 | Exceptional 30.1% |
| Immigrants | South Central Asia | 100.0 /100 | #15 | Exceptional 30.0% |
| Immigrants | Afghanistan | 100.0 /100 | #16 | Exceptional 30.0% |
| Hispanics or Latinos | 100.0 /100 | #17 | Exceptional 29.9% |
| Salvadorans | 100.0 /100 | #18 | Exceptional 29.9% |
| Alaska Natives | 100.0 /100 | #19 | Exceptional 29.9% |
| Immigrants | El Salvador | 100.0 /100 | #20 | Exceptional 29.8% |
| Immigrants | Laos | 100.0 /100 | #21 | Exceptional 29.8% |
| Malaysians | 100.0 /100 | #22 | Exceptional 29.8% |
| Mexican American Indians | 100.0 /100 | #23 | Exceptional 29.7% |