Immigrants from Middle Africa vs Immigrants from Afghanistan Family Households with Children
COMPARE
Immigrants from Middle Africa
Immigrants from Afghanistan
Family Households with Children
Family Households with Children Comparison
Immigrants from Middle Africa
Immigrants from Afghanistan
28.0%
FAMILY HOUSEHOLDS WITH CHILDREN
97.0/ 100
METRIC RATING
112th/ 347
METRIC RANK
30.0%
FAMILY HOUSEHOLDS WITH CHILDREN
100.0/ 100
METRIC RATING
16th/ 347
METRIC RANK
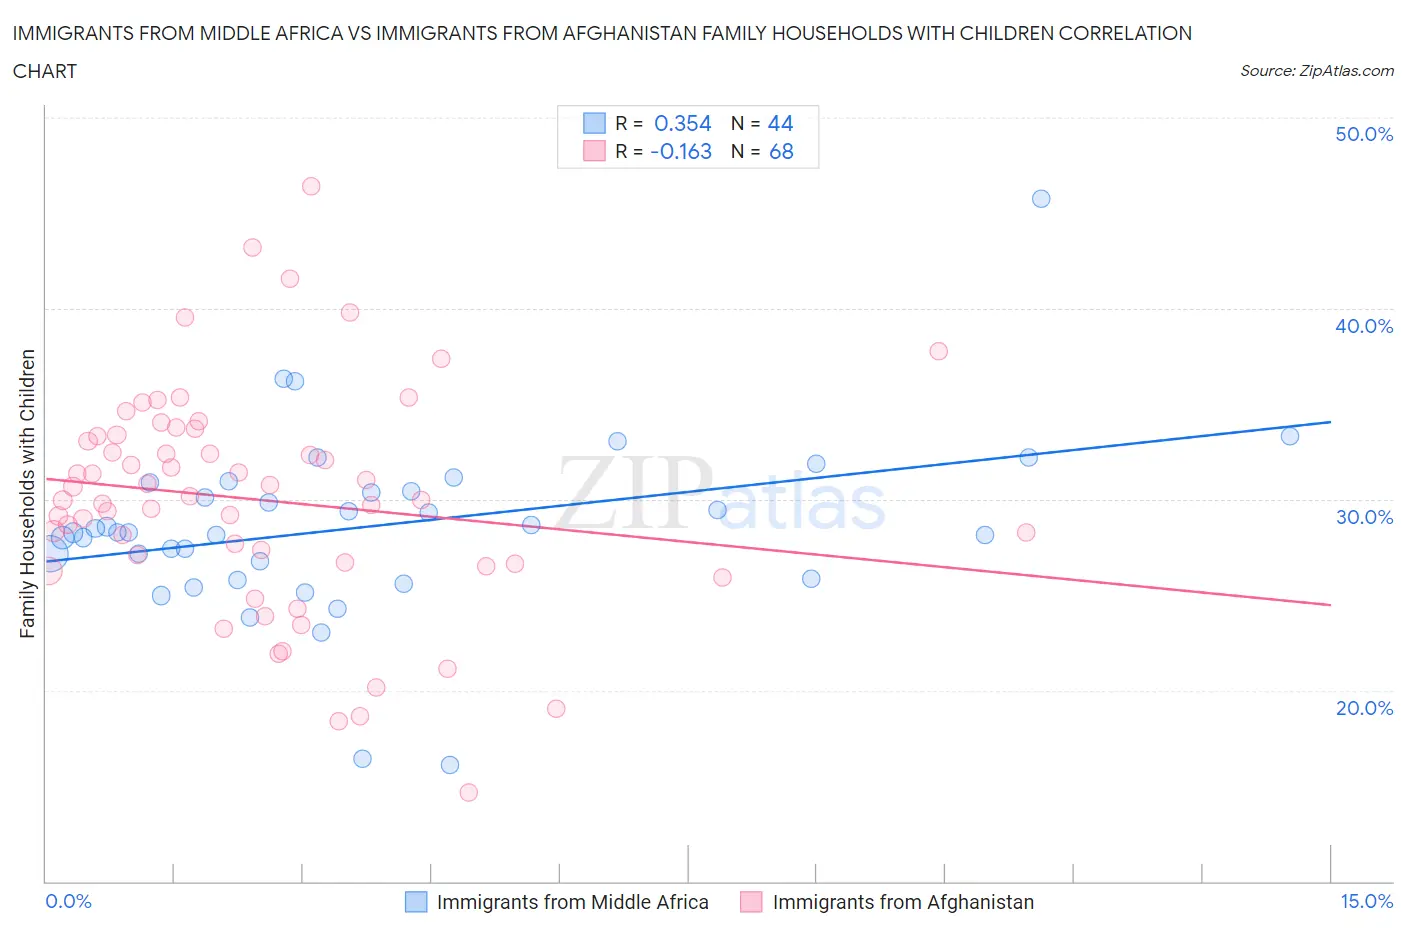
Immigrants from Middle Africa vs Immigrants from Afghanistan Family Households with Children Correlation Chart
The statistical analysis conducted on geographies consisting of 202,619,096 people shows a mild positive correlation between the proportion of Immigrants from Middle Africa and percentage of family households with children in the United States with a correlation coefficient (R) of 0.354 and weighted average of 28.0%. Similarly, the statistical analysis conducted on geographies consisting of 147,603,261 people shows a poor negative correlation between the proportion of Immigrants from Afghanistan and percentage of family households with children in the United States with a correlation coefficient (R) of -0.163 and weighted average of 30.0%, a difference of 7.4%.
Family Households with Children Correlation Summary
| Measurement | Immigrants from Middle Africa | Immigrants from Afghanistan |
| Minimum | 16.1% | 14.7% |
| Maximum | 45.8% | 46.4% |
| Range | 29.7% | 31.7% |
| Mean | 28.6% | 30.0% |
| Median | 28.2% | 30.1% |
| Interquartile 25% (IQ1) | 26.3% | 26.6% |
| Interquartile 75% (IQ3) | 30.7% | 33.3% |
| Interquartile Range (IQR) | 4.3% | 6.7% |
| Standard Deviation (Sample) | 4.7% | 5.9% |
| Standard Deviation (Population) | 4.7% | 5.9% |
Similar Demographics by Family Households with Children
Demographics Similar to Immigrants from Middle Africa by Family Households with Children
In terms of family households with children, the demographic groups most similar to Immigrants from Middle Africa are Arab (28.0%, a difference of 0.010%), Scandinavian (28.0%, a difference of 0.030%), South American Indian (28.0%, a difference of 0.030%), Immigrants from Africa (28.0%, a difference of 0.040%), and Spaniard (28.0%, a difference of 0.090%).
| Demographics | Rating | Rank | Family Households with Children |
| Choctaw | 98.3 /100 | #105 | Exceptional 28.1% |
| Immigrants | South America | 98.0 /100 | #106 | Exceptional 28.0% |
| Immigrants | Uganda | 97.7 /100 | #107 | Exceptional 28.0% |
| Immigrants | Burma/Myanmar | 97.7 /100 | #108 | Exceptional 28.0% |
| Tohono O'odham | 97.6 /100 | #109 | Exceptional 28.0% |
| Spaniards | 97.4 /100 | #110 | Exceptional 28.0% |
| Scandinavians | 97.1 /100 | #111 | Exceptional 28.0% |
| Immigrants | Middle Africa | 97.0 /100 | #112 | Exceptional 28.0% |
| Arabs | 97.0 /100 | #113 | Exceptional 28.0% |
| South American Indians | 96.9 /100 | #114 | Exceptional 28.0% |
| Immigrants | Africa | 96.8 /100 | #115 | Exceptional 28.0% |
| Pakistanis | 96.0 /100 | #116 | Exceptional 27.9% |
| Immigrants | Malaysia | 95.9 /100 | #117 | Exceptional 27.9% |
| Central American Indians | 95.9 /100 | #118 | Exceptional 27.9% |
| Zimbabweans | 95.6 /100 | #119 | Exceptional 27.9% |
Demographics Similar to Immigrants from Afghanistan by Family Households with Children
In terms of family households with children, the demographic groups most similar to Immigrants from Afghanistan are Immigrants from South Central Asia (30.0%, a difference of 0.020%), Bangladeshi (30.1%, a difference of 0.20%), Hispanic or Latino (29.9%, a difference of 0.39%), Afghan (30.2%, a difference of 0.48%), and Salvadoran (29.9%, a difference of 0.57%).
| Demographics | Rating | Rank | Family Households with Children |
| Thais | 100.0 /100 | #9 | Exceptional 30.6% |
| Immigrants | Fiji | 100.0 /100 | #10 | Exceptional 30.5% |
| Nepalese | 100.0 /100 | #11 | Exceptional 30.5% |
| Immigrants | Pakistan | 100.0 /100 | #12 | Exceptional 30.2% |
| Afghans | 100.0 /100 | #13 | Exceptional 30.2% |
| Bangladeshis | 100.0 /100 | #14 | Exceptional 30.1% |
| Immigrants | South Central Asia | 100.0 /100 | #15 | Exceptional 30.0% |
| Immigrants | Afghanistan | 100.0 /100 | #16 | Exceptional 30.0% |
| Hispanics or Latinos | 100.0 /100 | #17 | Exceptional 29.9% |
| Salvadorans | 100.0 /100 | #18 | Exceptional 29.9% |
| Alaska Natives | 100.0 /100 | #19 | Exceptional 29.9% |
| Immigrants | El Salvador | 100.0 /100 | #20 | Exceptional 29.8% |
| Immigrants | Laos | 100.0 /100 | #21 | Exceptional 29.8% |
| Malaysians | 100.0 /100 | #22 | Exceptional 29.8% |
| Mexican American Indians | 100.0 /100 | #23 | Exceptional 29.7% |