Immigrants from Greece vs Immigrants from England Family Households with Children
COMPARE
Immigrants from Greece
Immigrants from England
Family Households with Children
Family Households with Children Comparison
Immigrants from Greece
Immigrants from England
26.0%
FAMILY HOUSEHOLDS WITH CHILDREN
0.0/ 100
METRIC RATING
322nd/ 347
METRIC RANK
26.9%
FAMILY HOUSEHOLDS WITH CHILDREN
3.2/ 100
METRIC RATING
242nd/ 347
METRIC RANK
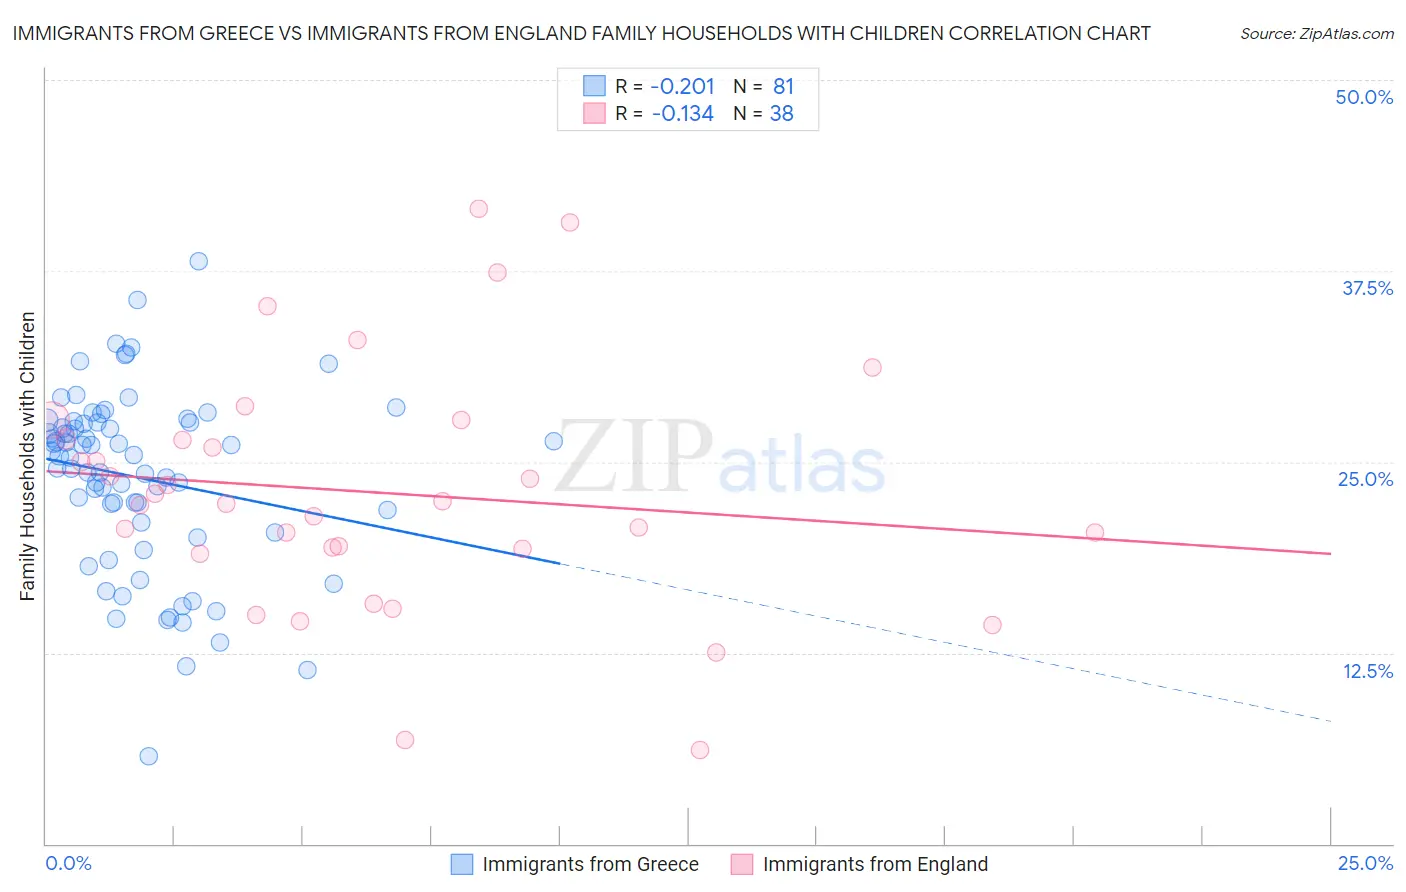
Immigrants from Greece vs Immigrants from England Family Households with Children Correlation Chart
The statistical analysis conducted on geographies consisting of 216,757,437 people shows a weak negative correlation between the proportion of Immigrants from Greece and percentage of family households with children in the United States with a correlation coefficient (R) of -0.201 and weighted average of 26.0%. Similarly, the statistical analysis conducted on geographies consisting of 391,583,092 people shows a poor negative correlation between the proportion of Immigrants from England and percentage of family households with children in the United States with a correlation coefficient (R) of -0.134 and weighted average of 26.9%, a difference of 3.5%.
Family Households with Children Correlation Summary
| Measurement | Immigrants from Greece | Immigrants from England |
| Minimum | 5.8% | 6.1% |
| Maximum | 38.1% | 41.6% |
| Range | 32.4% | 35.4% |
| Mean | 24.0% | 23.0% |
| Median | 25.4% | 22.3% |
| Interquartile 25% (IQ1) | 20.7% | 19.3% |
| Interquartile 75% (IQ3) | 27.6% | 26.5% |
| Interquartile Range (IQR) | 6.9% | 7.2% |
| Standard Deviation (Sample) | 5.9% | 8.0% |
| Standard Deviation (Population) | 5.9% | 7.9% |
Similar Demographics by Family Households with Children
Demographics Similar to Immigrants from Greece by Family Households with Children
In terms of family households with children, the demographic groups most similar to Immigrants from Greece are British West Indian (26.0%, a difference of 0.010%), Tlingit-Haida (26.0%, a difference of 0.030%), Immigrants from Australia (26.0%, a difference of 0.030%), Immigrants from France (26.0%, a difference of 0.040%), and Chinese (26.0%, a difference of 0.070%).
| Demographics | Rating | Rank | Family Households with Children |
| Immigrants | Norway | 0.0 /100 | #315 | Tragic 26.1% |
| Estonians | 0.0 /100 | #316 | Tragic 26.1% |
| Ottawa | 0.0 /100 | #317 | Tragic 26.1% |
| Iroquois | 0.0 /100 | #318 | Tragic 26.1% |
| Immigrants | France | 0.0 /100 | #319 | Tragic 26.0% |
| Tlingit-Haida | 0.0 /100 | #320 | Tragic 26.0% |
| British West Indians | 0.0 /100 | #321 | Tragic 26.0% |
| Immigrants | Greece | 0.0 /100 | #322 | Tragic 26.0% |
| Immigrants | Australia | 0.0 /100 | #323 | Tragic 26.0% |
| Chinese | 0.0 /100 | #324 | Tragic 26.0% |
| Barbadians | 0.0 /100 | #325 | Tragic 26.0% |
| Immigrants | Ireland | 0.0 /100 | #326 | Tragic 26.0% |
| Immigrants | Barbados | 0.0 /100 | #327 | Tragic 26.0% |
| Immigrants | Albania | 0.0 /100 | #328 | Tragic 25.9% |
| Cypriots | 0.0 /100 | #329 | Tragic 25.9% |
Demographics Similar to Immigrants from England by Family Households with Children
In terms of family households with children, the demographic groups most similar to Immigrants from England are Navajo (26.9%, a difference of 0.0%), Immigrants from Bulgaria (26.9%, a difference of 0.010%), Moroccan (26.9%, a difference of 0.030%), Immigrants from Southern Europe (26.9%, a difference of 0.030%), and Immigrants from Netherlands (26.9%, a difference of 0.040%).
| Demographics | Rating | Rank | Family Households with Children |
| Immigrants | Morocco | 4.2 /100 | #235 | Tragic 27.0% |
| Cape Verdeans | 3.6 /100 | #236 | Tragic 26.9% |
| Immigrants | Netherlands | 3.5 /100 | #237 | Tragic 26.9% |
| Moroccans | 3.4 /100 | #238 | Tragic 26.9% |
| Immigrants | Southern Europe | 3.4 /100 | #239 | Tragic 26.9% |
| Immigrants | Bulgaria | 3.3 /100 | #240 | Tragic 26.9% |
| Navajo | 3.2 /100 | #241 | Tragic 26.9% |
| Immigrants | England | 3.2 /100 | #242 | Tragic 26.9% |
| Immigrants | Saudi Arabia | 2.9 /100 | #243 | Tragic 26.9% |
| Ukrainians | 2.9 /100 | #244 | Tragic 26.9% |
| Australians | 2.8 /100 | #245 | Tragic 26.9% |
| Jamaicans | 2.5 /100 | #246 | Tragic 26.9% |
| Potawatomi | 2.2 /100 | #247 | Tragic 26.9% |
| Immigrants | Kazakhstan | 2.2 /100 | #248 | Tragic 26.9% |
| Immigrants | Eastern Europe | 2.1 /100 | #249 | Tragic 26.9% |