Immigrants from Greece vs Immigrants from Kenya Family Households with Children
COMPARE
Immigrants from Greece
Immigrants from Kenya
Family Households with Children
Family Households with Children Comparison
Immigrants from Greece
Immigrants from Kenya
26.0%
FAMILY HOUSEHOLDS WITH CHILDREN
0.0/ 100
METRIC RATING
322nd/ 347
METRIC RANK
28.1%
FAMILY HOUSEHOLDS WITH CHILDREN
98.9/ 100
METRIC RATING
98th/ 347
METRIC RANK
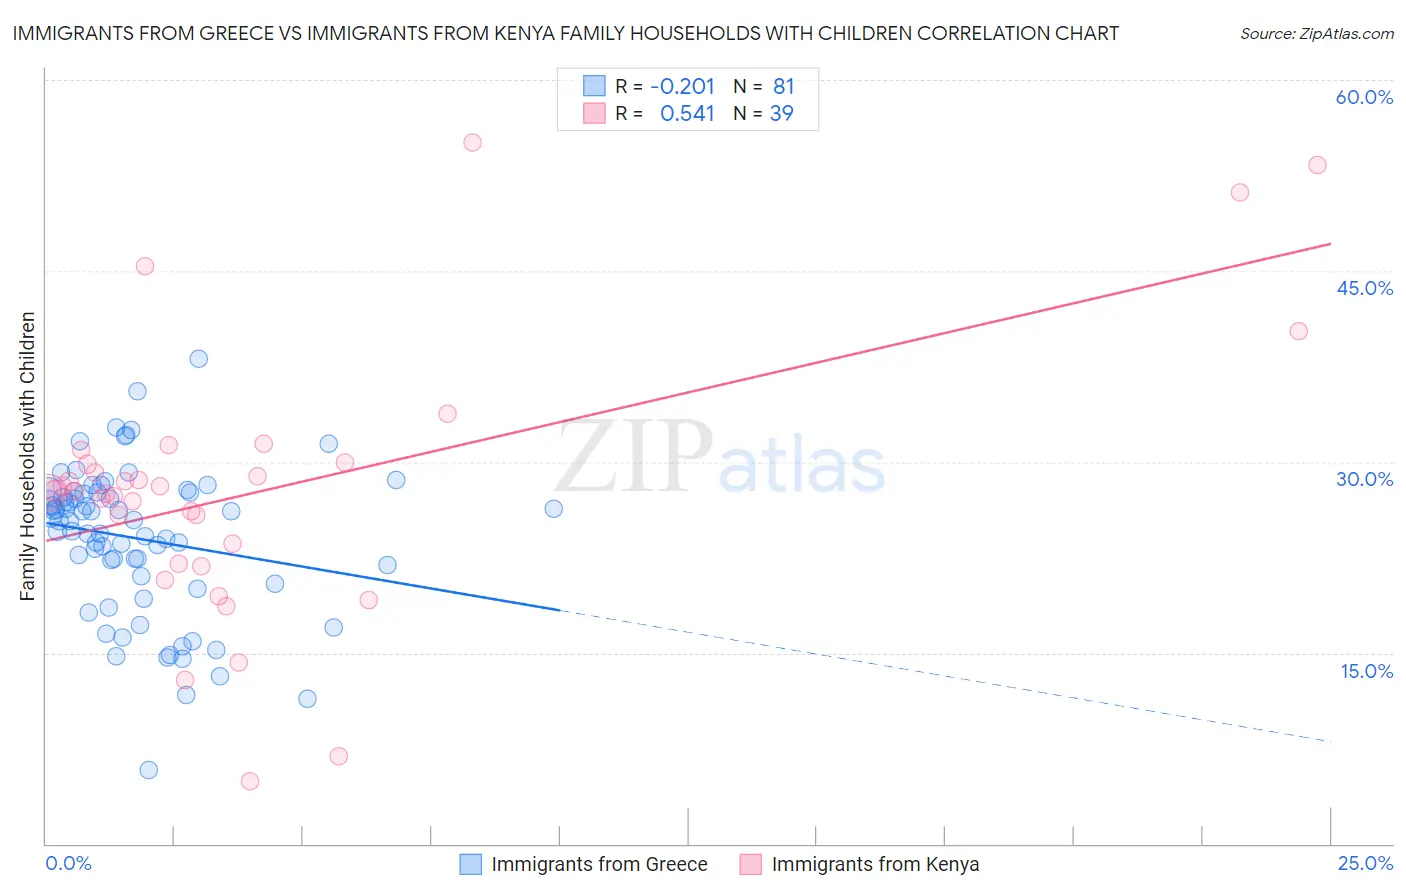
Immigrants from Greece vs Immigrants from Kenya Family Households with Children Correlation Chart
The statistical analysis conducted on geographies consisting of 216,757,437 people shows a weak negative correlation between the proportion of Immigrants from Greece and percentage of family households with children in the United States with a correlation coefficient (R) of -0.201 and weighted average of 26.0%. Similarly, the statistical analysis conducted on geographies consisting of 217,949,072 people shows a substantial positive correlation between the proportion of Immigrants from Kenya and percentage of family households with children in the United States with a correlation coefficient (R) of 0.541 and weighted average of 28.1%, a difference of 8.1%.
Family Households with Children Correlation Summary
| Measurement | Immigrants from Greece | Immigrants from Kenya |
| Minimum | 5.8% | 4.9% |
| Maximum | 38.1% | 55.1% |
| Range | 32.4% | 50.2% |
| Mean | 24.0% | 27.9% |
| Median | 25.4% | 27.7% |
| Interquartile 25% (IQ1) | 20.7% | 22.0% |
| Interquartile 75% (IQ3) | 27.6% | 29.9% |
| Interquartile Range (IQR) | 6.9% | 8.0% |
| Standard Deviation (Sample) | 5.9% | 10.6% |
| Standard Deviation (Population) | 5.9% | 10.4% |
Similar Demographics by Family Households with Children
Demographics Similar to Immigrants from Greece by Family Households with Children
In terms of family households with children, the demographic groups most similar to Immigrants from Greece are British West Indian (26.0%, a difference of 0.010%), Tlingit-Haida (26.0%, a difference of 0.030%), Immigrants from Australia (26.0%, a difference of 0.030%), Immigrants from France (26.0%, a difference of 0.040%), and Chinese (26.0%, a difference of 0.070%).
| Demographics | Rating | Rank | Family Households with Children |
| Immigrants | Norway | 0.0 /100 | #315 | Tragic 26.1% |
| Estonians | 0.0 /100 | #316 | Tragic 26.1% |
| Ottawa | 0.0 /100 | #317 | Tragic 26.1% |
| Iroquois | 0.0 /100 | #318 | Tragic 26.1% |
| Immigrants | France | 0.0 /100 | #319 | Tragic 26.0% |
| Tlingit-Haida | 0.0 /100 | #320 | Tragic 26.0% |
| British West Indians | 0.0 /100 | #321 | Tragic 26.0% |
| Immigrants | Greece | 0.0 /100 | #322 | Tragic 26.0% |
| Immigrants | Australia | 0.0 /100 | #323 | Tragic 26.0% |
| Chinese | 0.0 /100 | #324 | Tragic 26.0% |
| Barbadians | 0.0 /100 | #325 | Tragic 26.0% |
| Immigrants | Ireland | 0.0 /100 | #326 | Tragic 26.0% |
| Immigrants | Barbados | 0.0 /100 | #327 | Tragic 26.0% |
| Immigrants | Albania | 0.0 /100 | #328 | Tragic 25.9% |
| Cypriots | 0.0 /100 | #329 | Tragic 25.9% |
Demographics Similar to Immigrants from Kenya by Family Households with Children
In terms of family households with children, the demographic groups most similar to Immigrants from Kenya are Immigrants from the Azores (28.1%, a difference of 0.010%), Indonesian (28.1%, a difference of 0.010%), Immigrants from Oceania (28.1%, a difference of 0.030%), Chilean (28.1%, a difference of 0.040%), and Assyrian/Chaldean/Syriac (28.1%, a difference of 0.060%).
| Demographics | Rating | Rank | Family Households with Children |
| Immigrants | Liberia | 99.4 /100 | #91 | Exceptional 28.2% |
| Chickasaw | 99.4 /100 | #92 | Exceptional 28.2% |
| Panamanians | 99.3 /100 | #93 | Exceptional 28.2% |
| Immigrants | Colombia | 99.2 /100 | #94 | Exceptional 28.2% |
| Immigrants | Nicaragua | 99.1 /100 | #95 | Exceptional 28.2% |
| Ute | 99.1 /100 | #96 | Exceptional 28.2% |
| Chileans | 98.9 /100 | #97 | Exceptional 28.1% |
| Immigrants | Kenya | 98.9 /100 | #98 | Exceptional 28.1% |
| Immigrants | Azores | 98.8 /100 | #99 | Exceptional 28.1% |
| Indonesians | 98.8 /100 | #100 | Exceptional 28.1% |
| Immigrants | Oceania | 98.8 /100 | #101 | Exceptional 28.1% |
| Assyrians/Chaldeans/Syriacs | 98.7 /100 | #102 | Exceptional 28.1% |
| Palestinians | 98.5 /100 | #103 | Exceptional 28.1% |
| Sioux | 98.3 /100 | #104 | Exceptional 28.1% |
| Choctaw | 98.3 /100 | #105 | Exceptional 28.1% |