German Russian vs Immigrants from Afghanistan Family Households with Children

COMPARE

German Russian
Race
Ancestry
AfghanAfricanAlaska NativeAlaskan AthabascanAlbanianAleutAlsatianAmericanApacheArabArapahoArgentineanArmenianAssyrian/Chaldean/SyriacAustralianAustrianBahamianBangladeshiBarbadianBasqueBelgianBelizeanBermudanBhutaneseBlackfeetBolivianBrazilianBritishBritish West IndianBulgarianBurmeseCajunCambodianCanadianCape VerdeanCarpatho RusynCelticCentral AmericanCentral American IndianCherokeeCheyenneChickasawChileanChineseChippewaChoctawColombianColvilleComancheCosta RicanCreeCreekCroatianCrowCubanCypriotCzechCzechoslovakianDanishDelawareDominicanDutchDutch West IndianEastern EuropeanEcuadorianEgyptianEnglishEstonianEthiopianEuropeanFijianFilipinoFinnishFrenchFrench American IndianFrench CanadianGermanGerman RussianGhanaianGreekGuamanian/ChamorroGuatemalanGuyaneseHaitianHmongHonduranHopiHoumaHungarianIcelanderIndian (Asian)IndonesianInupiatIranianIraqiIrishIroquoisIsraeliItalianJamaicanJapaneseJordanianKenyanKiowaKoreanLaotianLatvianLebaneseLiberianLithuanianLumbeeLuxembourgerMacedonianMalaysianMalteseMarshalleseMenomineeMexicanMexican American IndianMongolianMoroccanNative HawaiianNavajoNepaleseNew ZealanderNicaraguanNigerianNorthern EuropeanNorwegianOkinawanOsageOttawaPaiutePakistaniPalestinianPanamanianParaguayanPennsylvania GermanPeruvianPimaPolishPortuguesePotawatomiPuebloPuerto RicanPuget Sound SalishRomanianRussianSalvadoranSamoanScandinavianScotch-IrishScottishSeminoleSenegaleseSerbianShoshoneSierra LeoneanSiouxSlavicSlovakSloveneSomaliSouth AfricanSouth AmericanSouth American IndianSoviet UnionSpaniardSpanishSpanish AmericanSpanish American IndianSri LankanSubsaharan AfricanSudaneseSwedishSwissSyrianTaiwaneseThaiTlingit-HaidaTohono O'OdhamTonganTrinidadian and TobagonianTsimshianTurkishU.S. Virgin IslanderUgandanUkrainianUruguayanUteVenezuelanVietnameseWelshWest IndianYakamaYaquiYugoslavianYumanYup'ikZimbabwean
Immigration
NonimmigrantsImmigrantsAfricaAlbaniaArgentinaArmeniaAsiaAustraliaAustriaBahamasBangladeshBarbadosBelarusBelgiumBelizeBoliviaBosnia and HerzegovinaBrazilBulgariaBurma/MyanmarCabo VerdeCambodiaCameroonCanadaCaribbeanCentral AmericaChileChinaColombiaCongoCosta RicaCroatiaCubaCzechoslovakiaDenmarkDominicaDominican RepublicEastern AfricaEastern AsiaEastern EuropeEcuadorEgyptEl SalvadorEnglandEritreaEthiopiaEuropeFijiFranceGermanyGhanaGreeceGrenadaGuatemalaGuyanaHaitiHondurasHong KongHungaryIndiaIndonesiaIranIraqIrelandIsraelItalyJamaicaJapanJordanKazakhstanKenyaKoreaKuwaitLaosLatin AmericaLatviaLebanonLiberiaLithuaniaMalaysiaMexicoMicronesiaMiddle AfricaMoldovaMoroccoNepalNetherlandsNicaraguaNigeriaNorth AmericaNorth MacedoniaNorthern AfricaNorthern EuropeNorwayOceaniaPakistanPanamaPeruPhilippinesPolandPortugalRomaniaRussiaSaudi ArabiaScotlandSenegalSerbiaSierra LeoneSingaporeSomaliaSouth AfricaSouth AmericaSouth Central AsiaSouth Eastern AsiaSouthern EuropeSpainSri LankaSt. Vincent and the GrenadinesSudanSwedenSwitzerlandSyriaTaiwanThailandTrinidad and TobagoTurkeyUgandaUkraineUruguayUzbekistanVenezuelaVietnamWest IndiesWestern AfricaWestern AsiaWestern EuropeYemenZaireZimbabweAzores
Immigrants from Afghanistan
Race
Ancestry
AfghanAfricanAlaska NativeAlaskan AthabascanAlbanianAleutAlsatianAmericanApacheArabArapahoArgentineanArmenianAssyrian/Chaldean/SyriacAustralianAustrianBahamianBangladeshiBarbadianBasqueBelgianBelizeanBermudanBhutaneseBlackfeetBolivianBrazilianBritishBritish West IndianBulgarianBurmeseCajunCambodianCanadianCape VerdeanCarpatho RusynCelticCentral AmericanCentral American IndianCherokeeCheyenneChickasawChileanChineseChippewaChoctawColombianColvilleComancheCosta RicanCreeCreekCroatianCrowCubanCypriotCzechCzechoslovakianDanishDelawareDominicanDutchDutch West IndianEastern EuropeanEcuadorianEgyptianEnglishEstonianEthiopianEuropeanFijianFilipinoFinnishFrenchFrench American IndianFrench CanadianGermanGhanaianGreekGuamanian/ChamorroGuatemalanGuyaneseHaitianHmongHonduranHopiHoumaHungarianIcelanderIndian (Asian)IndonesianInupiatIranianIraqiIrishIroquoisIsraeliItalianJamaicanJapaneseJordanianKenyanKiowaKoreanLaotianLatvianLebaneseLiberianLithuanianLumbeeLuxembourgerMacedonianMalaysianMalteseMarshalleseMenomineeMexicanMexican American IndianMongolianMoroccanNative HawaiianNavajoNepaleseNew ZealanderNicaraguanNigerianNorthern EuropeanNorwegianOkinawanOsageOttawaPaiutePakistaniPalestinianPanamanianParaguayanPennsylvania GermanPeruvianPimaPolishPortuguesePotawatomiPuebloPuerto RicanPuget Sound SalishRomanianRussianSalvadoranSamoanScandinavianScotch-IrishScottishSeminoleSenegaleseSerbianShoshoneSierra LeoneanSiouxSlavicSlovakSloveneSomaliSouth AfricanSouth AmericanSouth American IndianSoviet UnionSpaniardSpanishSpanish AmericanSpanish American IndianSri LankanSubsaharan AfricanSudaneseSwedishSwissSyrianTaiwaneseThaiTlingit-HaidaTohono O'OdhamTonganTrinidadian and TobagonianTsimshianTurkishU.S. Virgin IslanderUgandanUkrainianUruguayanUteVenezuelanVietnameseWelshWest IndianYakamaYaquiYugoslavianYumanYup'ikZimbabwean
Immigration
NonimmigrantsImmigrantsAfghanistanAfricaAlbaniaArgentinaArmeniaAsiaAustraliaAustriaBahamasBangladeshBarbadosBelarusBelgiumBelizeBoliviaBosnia and HerzegovinaBrazilBulgariaBurma/MyanmarCabo VerdeCambodiaCameroonCanadaCaribbeanCentral AmericaChileChinaColombiaCongoCosta RicaCroatiaCubaCzechoslovakiaDenmarkDominicaDominican RepublicEastern AfricaEastern AsiaEastern EuropeEcuadorEgyptEl SalvadorEnglandEritreaEthiopiaEuropeFijiFranceGermanyGhanaGreeceGrenadaGuatemalaGuyanaHaitiHondurasHong KongHungaryIndiaIndonesiaIranIraqIrelandIsraelItalyJamaicaJapanJordanKazakhstanKenyaKoreaKuwaitLaosLatin AmericaLatviaLebanonLiberiaLithuaniaMalaysiaMexicoMicronesiaMiddle AfricaMoldovaMoroccoNepalNetherlandsNicaraguaNigeriaNorth AmericaNorth MacedoniaNorthern AfricaNorthern EuropeNorwayOceaniaPakistanPanamaPeruPhilippinesPolandPortugalRomaniaRussiaSaudi ArabiaScotlandSenegalSerbiaSierra LeoneSingaporeSomaliaSouth AfricaSouth AmericaSouth Central AsiaSouth Eastern AsiaSouthern EuropeSpainSri LankaSt. Vincent and the GrenadinesSudanSwedenSwitzerlandSyriaTaiwanThailandTrinidad and TobagoTurkeyUgandaUkraineUruguayUzbekistanVenezuelaVietnamWest IndiesWestern AfricaWestern AsiaWestern EuropeYemenZaireZimbabweAzores
Family Households with Children
Income
Poverty
Unemployment
Labor Participation
Family Structure
Vehicle Availability
Education Level
Disability

Family Households with Children Comparison

German Russians

Immigrants from Afghanistan

Tragic
Exceptional
26.8%
FAMILY HOUSEHOLDS WITH CHILDREN
1.5/ 100
METRIC RATING
255th/ 347
METRIC RANK
30.0%
FAMILY HOUSEHOLDS WITH CHILDREN
100.0/ 100
METRIC RATING
16th/ 347
METRIC RANK

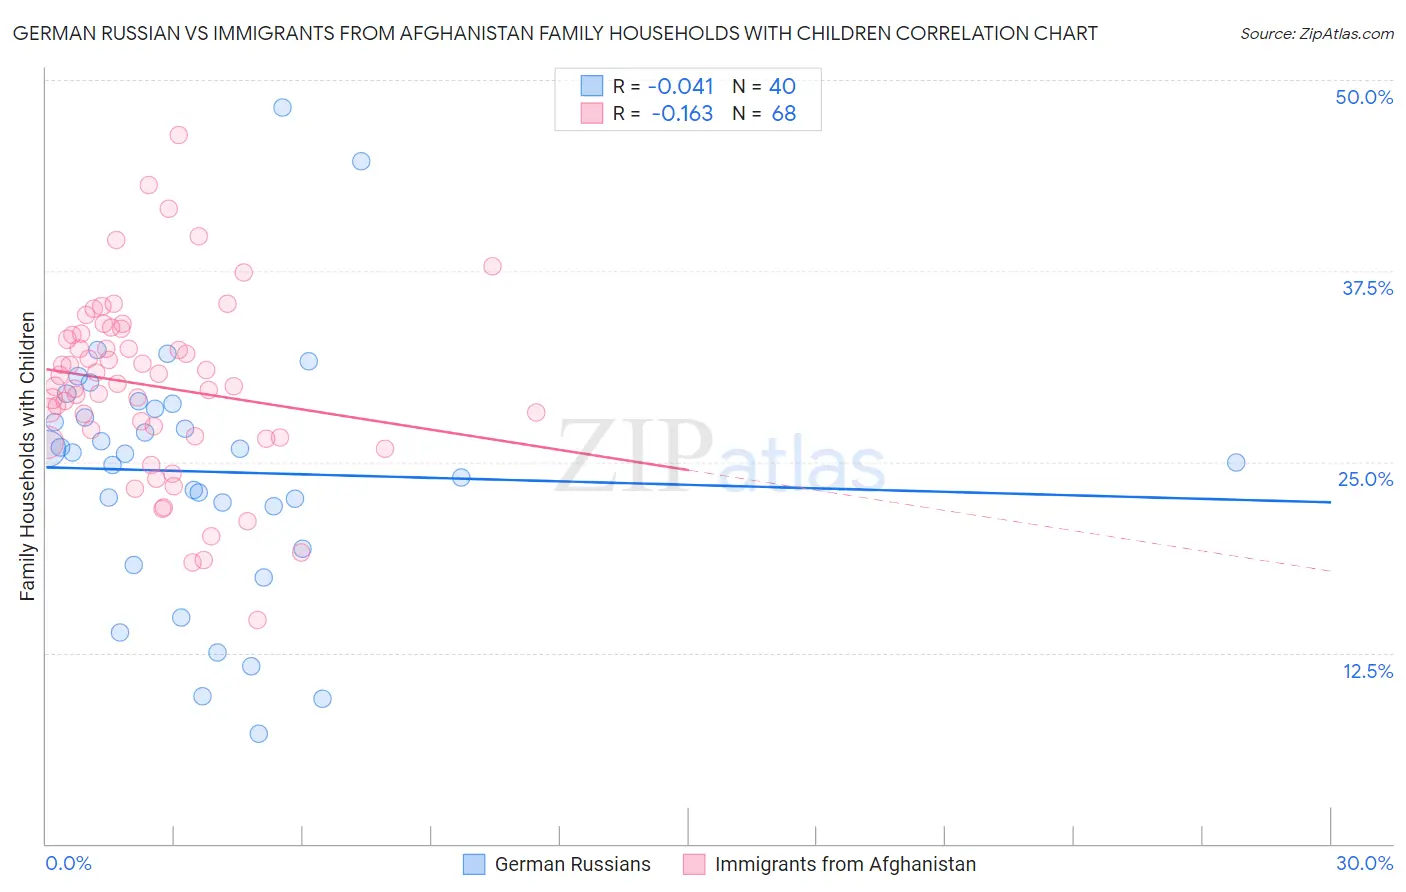
German Russian vs Immigrants from Afghanistan Family Households with Children Correlation Chart

The statistical analysis conducted on geographies consisting of 96,442,482 people shows no correlation between the proportion of German Russians and percentage of family households with children in the United States with a correlation coefficient (R) of -0.041 and weighted average of 26.8%. Similarly, the statistical analysis conducted on geographies consisting of 147,603,261 people shows a poor negative correlation between the proportion of Immigrants from Afghanistan and percentage of family households with children in the United States with a correlation coefficient (R) of -0.163 and weighted average of 30.0%, a difference of 12.0%.
German Russian vs Immigrants from Afghanistan Family Households with Children

Family Households with Children Correlation Summary

MeasurementGerman RussianImmigrants from Afghanistan
Minimum7.2%14.7%
Maximum48.2%46.4%
Range41.0%31.7%
Mean24.4%30.0%
Median25.6%30.1%
Interquartile 25% (IQ1)20.7%26.6%
Interquartile 75% (IQ3)28.7%33.3%
Interquartile Range (IQR)7.9%6.7%
Standard Deviation (Sample)8.4%5.9%
Standard Deviation (Population)8.3%5.9%

Similar Demographics by Family Households with Children

Demographics Similar to German Russians by Family Households with Children

In terms of family households with children, the demographic groups most similar to German Russians are Immigrants from Scotland (26.8%, a difference of 0.0%), Scotch-Irish (26.8%, a difference of 0.010%), Italian (26.8%, a difference of 0.030%), Slavic (26.8%, a difference of 0.060%), and Immigrants from Cuba (26.8%, a difference of 0.070%).
DemographicsRating | RankFamily Households with Children
Immigrants | Kazakhstan
2.2
/100
|
#248
Tragic
26.9%
Immigrants | Eastern Europe
2.1
/100
|
#249
Tragic
26.9%
Belgians
2.1
/100
|
#250
Tragic
26.9%
Immigrants | Bosnia and Herzegovina
1.9
/100
|
#251
Tragic
26.8%
Irish
1.8
/100
|
#252
Tragic
26.8%
Italians
1.5
/100
|
#253
Tragic
26.8%
Immigrants | Scotland
1.5
/100
|
#254
Tragic
26.8%
German Russians
1.5
/100
|
#255
Tragic
26.8%
Scotch-Irish
1.4
/100
|
#256
Tragic
26.8%
Slavs
1.3
/100
|
#257
Tragic
26.8%
Immigrants | Cuba
1.3
/100
|
#258
Tragic
26.8%
Immigrants | Lithuania
1.2
/100
|
#259
Tragic
26.8%
Immigrants | Jamaica
1.2
/100
|
#260
Tragic
26.8%
Immigrants | Belarus
1.1
/100
|
#261
Tragic
26.8%
Immigrants | Russia
1.0
/100
|
#262
Tragic
26.8%

Demographics Similar to Immigrants from Afghanistan by Family Households with Children

In terms of family households with children, the demographic groups most similar to Immigrants from Afghanistan are Immigrants from South Central Asia (30.0%, a difference of 0.020%), Bangladeshi (30.1%, a difference of 0.20%), Hispanic or Latino (29.9%, a difference of 0.39%), Afghan (30.2%, a difference of 0.48%), and Salvadoran (29.9%, a difference of 0.57%).
DemographicsRating | RankFamily Households with Children
Thais
100.0
/100
|
#9
Exceptional
30.6%
Immigrants | Fiji
100.0
/100
|
#10
Exceptional
30.5%
Nepalese
100.0
/100
|
#11
Exceptional
30.5%
Immigrants | Pakistan
100.0
/100
|
#12
Exceptional
30.2%
Afghans
100.0
/100
|
#13
Exceptional
30.2%
Bangladeshis
100.0
/100
|
#14
Exceptional
30.1%
Immigrants | South Central Asia
100.0
/100
|
#15
Exceptional
30.0%
Immigrants | Afghanistan
100.0
/100
|
#16
Exceptional
30.0%
Hispanics or Latinos
100.0
/100
|
#17
Exceptional
29.9%
Salvadorans
100.0
/100
|
#18
Exceptional
29.9%
Alaska Natives
100.0
/100
|
#19
Exceptional
29.9%
Immigrants | El Salvador
100.0
/100
|
#20
Exceptional
29.8%
Immigrants | Laos
100.0
/100
|
#21
Exceptional
29.8%
Malaysians
100.0
/100
|
#22
Exceptional
29.8%
Mexican American Indians
100.0
/100
|
#23
Exceptional
29.7%