Irish vs Immigrants from Afghanistan Family Households with Children
COMPARE
Irish
Immigrants from Afghanistan
Family Households with Children
Family Households with Children Comparison
Irish
Immigrants from Afghanistan
26.8%
FAMILY HOUSEHOLDS WITH CHILDREN
1.8/ 100
METRIC RATING
252nd/ 347
METRIC RANK
30.0%
FAMILY HOUSEHOLDS WITH CHILDREN
100.0/ 100
METRIC RATING
16th/ 347
METRIC RANK
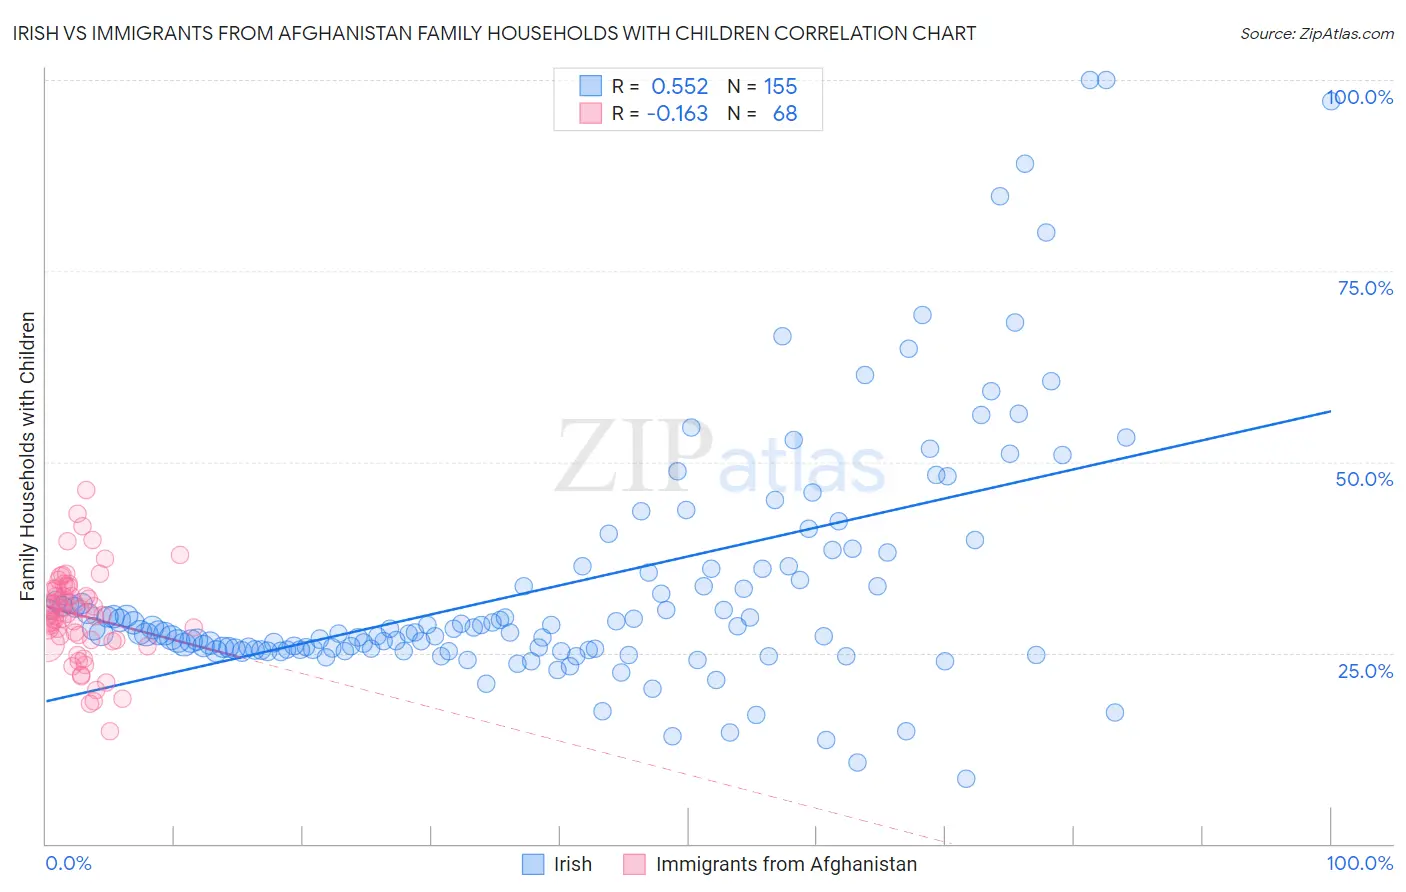
Irish vs Immigrants from Afghanistan Family Households with Children Correlation Chart
The statistical analysis conducted on geographies consisting of 579,410,491 people shows a substantial positive correlation between the proportion of Irish and percentage of family households with children in the United States with a correlation coefficient (R) of 0.552 and weighted average of 26.8%. Similarly, the statistical analysis conducted on geographies consisting of 147,603,261 people shows a poor negative correlation between the proportion of Immigrants from Afghanistan and percentage of family households with children in the United States with a correlation coefficient (R) of -0.163 and weighted average of 30.0%, a difference of 11.9%.
Family Households with Children Correlation Summary
| Measurement | Irish | Immigrants from Afghanistan |
| Minimum | 8.5% | 14.7% |
| Maximum | 100.0% | 46.4% |
| Range | 91.5% | 31.7% |
| Mean | 33.6% | 30.0% |
| Median | 27.6% | 30.1% |
| Interquartile 25% (IQ1) | 25.4% | 26.6% |
| Interquartile 75% (IQ3) | 36.0% | 33.3% |
| Interquartile Range (IQR) | 10.5% | 6.7% |
| Standard Deviation (Sample) | 16.3% | 5.9% |
| Standard Deviation (Population) | 16.2% | 5.9% |
Similar Demographics by Family Households with Children
Demographics Similar to Irish by Family Households with Children
In terms of family households with children, the demographic groups most similar to Irish are Immigrants from Bosnia and Herzegovina (26.8%, a difference of 0.030%), Italian (26.8%, a difference of 0.080%), Belgian (26.9%, a difference of 0.090%), Immigrants from Eastern Europe (26.9%, a difference of 0.10%), and Immigrants from Scotland (26.8%, a difference of 0.10%).
| Demographics | Rating | Rank | Family Households with Children |
| Australians | 2.8 /100 | #245 | Tragic 26.9% |
| Jamaicans | 2.5 /100 | #246 | Tragic 26.9% |
| Potawatomi | 2.2 /100 | #247 | Tragic 26.9% |
| Immigrants | Kazakhstan | 2.2 /100 | #248 | Tragic 26.9% |
| Immigrants | Eastern Europe | 2.1 /100 | #249 | Tragic 26.9% |
| Belgians | 2.1 /100 | #250 | Tragic 26.9% |
| Immigrants | Bosnia and Herzegovina | 1.9 /100 | #251 | Tragic 26.8% |
| Irish | 1.8 /100 | #252 | Tragic 26.8% |
| Italians | 1.5 /100 | #253 | Tragic 26.8% |
| Immigrants | Scotland | 1.5 /100 | #254 | Tragic 26.8% |
| German Russians | 1.5 /100 | #255 | Tragic 26.8% |
| Scotch-Irish | 1.4 /100 | #256 | Tragic 26.8% |
| Slavs | 1.3 /100 | #257 | Tragic 26.8% |
| Immigrants | Cuba | 1.3 /100 | #258 | Tragic 26.8% |
| Immigrants | Lithuania | 1.2 /100 | #259 | Tragic 26.8% |
Demographics Similar to Immigrants from Afghanistan by Family Households with Children
In terms of family households with children, the demographic groups most similar to Immigrants from Afghanistan are Immigrants from South Central Asia (30.0%, a difference of 0.020%), Bangladeshi (30.1%, a difference of 0.20%), Hispanic or Latino (29.9%, a difference of 0.39%), Afghan (30.2%, a difference of 0.48%), and Salvadoran (29.9%, a difference of 0.57%).
| Demographics | Rating | Rank | Family Households with Children |
| Thais | 100.0 /100 | #9 | Exceptional 30.6% |
| Immigrants | Fiji | 100.0 /100 | #10 | Exceptional 30.5% |
| Nepalese | 100.0 /100 | #11 | Exceptional 30.5% |
| Immigrants | Pakistan | 100.0 /100 | #12 | Exceptional 30.2% |
| Afghans | 100.0 /100 | #13 | Exceptional 30.2% |
| Bangladeshis | 100.0 /100 | #14 | Exceptional 30.1% |
| Immigrants | South Central Asia | 100.0 /100 | #15 | Exceptional 30.0% |
| Immigrants | Afghanistan | 100.0 /100 | #16 | Exceptional 30.0% |
| Hispanics or Latinos | 100.0 /100 | #17 | Exceptional 29.9% |
| Salvadorans | 100.0 /100 | #18 | Exceptional 29.9% |
| Alaska Natives | 100.0 /100 | #19 | Exceptional 29.9% |
| Immigrants | El Salvador | 100.0 /100 | #20 | Exceptional 29.8% |
| Immigrants | Laos | 100.0 /100 | #21 | Exceptional 29.8% |
| Malaysians | 100.0 /100 | #22 | Exceptional 29.8% |
| Mexican American Indians | 100.0 /100 | #23 | Exceptional 29.7% |