Immigrants from Ethiopia vs Costa Rican Births to Unmarried Women
COMPARE
Immigrants from Ethiopia
Costa Rican
Births to Unmarried Women
Births to Unmarried Women Comparison
Immigrants from Ethiopia
Costa Ricans
29.7%
BIRTHS TO UNMARRIED WOMEN
93.4/ 100
METRIC RATING
110th/ 347
METRIC RANK
32.7%
BIRTHS TO UNMARRIED WOMEN
20.3/ 100
METRIC RATING
198th/ 347
METRIC RANK
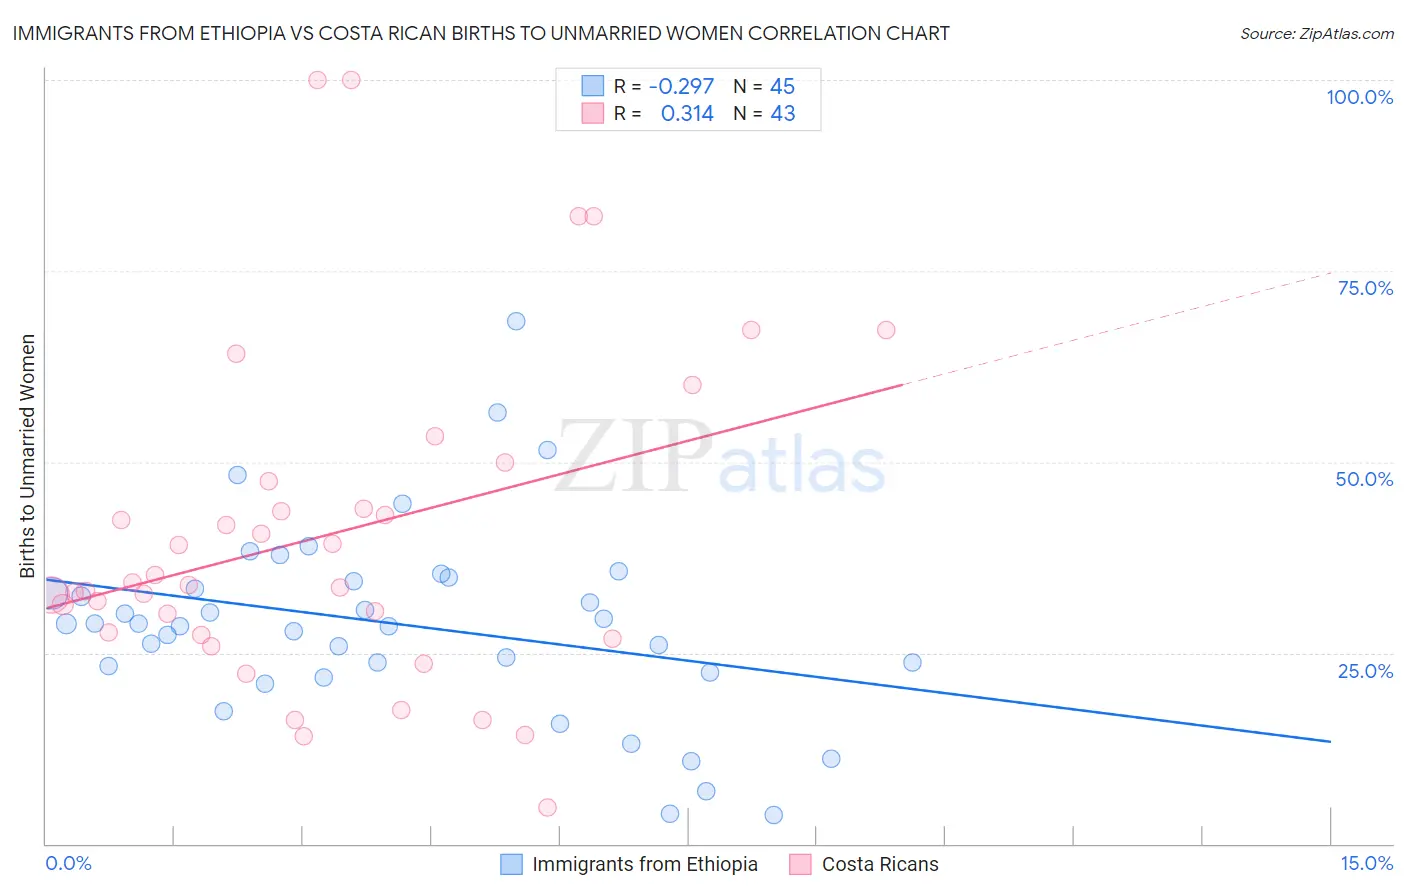
Immigrants from Ethiopia vs Costa Rican Births to Unmarried Women Correlation Chart
The statistical analysis conducted on geographies consisting of 204,461,037 people shows a weak negative correlation between the proportion of Immigrants from Ethiopia and percentage of births to unmarried women in the United States with a correlation coefficient (R) of -0.297 and weighted average of 29.7%. Similarly, the statistical analysis conducted on geographies consisting of 243,618,809 people shows a mild positive correlation between the proportion of Costa Ricans and percentage of births to unmarried women in the United States with a correlation coefficient (R) of 0.314 and weighted average of 32.7%, a difference of 10.1%.
Births to Unmarried Women Correlation Summary
| Measurement | Immigrants from Ethiopia | Costa Rican |
| Minimum | 3.7% | 4.8% |
| Maximum | 68.3% | 100.0% |
| Range | 64.6% | 95.2% |
| Mean | 28.8% | 40.4% |
| Median | 28.8% | 33.9% |
| Interquartile 25% (IQ1) | 22.8% | 27.3% |
| Interquartile 75% (IQ3) | 34.7% | 47.4% |
| Interquartile Range (IQR) | 11.8% | 20.1% |
| Standard Deviation (Sample) | 12.8% | 21.7% |
| Standard Deviation (Population) | 12.6% | 21.4% |
Similar Demographics by Births to Unmarried Women
Demographics Similar to Immigrants from Ethiopia by Births to Unmarried Women
In terms of births to unmarried women, the demographic groups most similar to Immigrants from Ethiopia are Greek (29.7%, a difference of 0.030%), Paraguayan (29.7%, a difference of 0.070%), Immigrants from Hungary (29.7%, a difference of 0.14%), Immigrants from Brazil (29.6%, a difference of 0.15%), and Basque (29.7%, a difference of 0.15%).
| Demographics | Rating | Rank | Births to Unmarried Women |
| Lebanese | 94.4 /100 | #103 | Exceptional 29.5% |
| Lithuanians | 94.4 /100 | #104 | Exceptional 29.6% |
| Immigrants | Nepal | 94.3 /100 | #105 | Exceptional 29.6% |
| Swedes | 93.8 /100 | #106 | Exceptional 29.6% |
| Immigrants | Brazil | 93.7 /100 | #107 | Exceptional 29.6% |
| Paraguayans | 93.5 /100 | #108 | Exceptional 29.7% |
| Greeks | 93.4 /100 | #109 | Exceptional 29.7% |
| Immigrants | Ethiopia | 93.4 /100 | #110 | Exceptional 29.7% |
| Immigrants | Hungary | 93.0 /100 | #111 | Exceptional 29.7% |
| Basques | 93.0 /100 | #112 | Exceptional 29.7% |
| Scandinavians | 92.7 /100 | #113 | Exceptional 29.8% |
| Immigrants | Croatia | 92.6 /100 | #114 | Exceptional 29.8% |
| Ethiopians | 91.9 /100 | #115 | Exceptional 29.8% |
| Immigrants | Italy | 91.7 /100 | #116 | Exceptional 29.9% |
| Immigrants | Netherlands | 91.1 /100 | #117 | Exceptional 29.9% |
Demographics Similar to Costa Ricans by Births to Unmarried Women
In terms of births to unmarried women, the demographic groups most similar to Costa Ricans are Immigrants (32.7%, a difference of 0.050%), Immigrants from Colombia (32.6%, a difference of 0.20%), Immigrants from Thailand (32.8%, a difference of 0.20%), Immigrants from Germany (32.8%, a difference of 0.22%), and Samoan (32.6%, a difference of 0.23%).
| Demographics | Rating | Rank | Births to Unmarried Women |
| Irish | 32.4 /100 | #191 | Fair 32.2% |
| Colombians | 31.9 /100 | #192 | Fair 32.2% |
| Fijians | 31.1 /100 | #193 | Fair 32.3% |
| Sudanese | 27.3 /100 | #194 | Fair 32.4% |
| Samoans | 21.9 /100 | #195 | Fair 32.6% |
| Immigrants | Colombia | 21.7 /100 | #196 | Fair 32.6% |
| Immigrants | Immigrants | 20.6 /100 | #197 | Fair 32.7% |
| Costa Ricans | 20.3 /100 | #198 | Fair 32.7% |
| Immigrants | Thailand | 18.9 /100 | #199 | Poor 32.8% |
| Immigrants | Germany | 18.8 /100 | #200 | Poor 32.8% |
| Immigrants | Burma/Myanmar | 16.7 /100 | #201 | Poor 32.9% |
| Immigrants | Micronesia | 16.6 /100 | #202 | Poor 32.9% |
| Ute | 14.4 /100 | #203 | Poor 33.0% |
| Immigrants | Africa | 14.3 /100 | #204 | Poor 33.0% |
| German Russians | 13.1 /100 | #205 | Poor 33.1% |