Immigrants from Eritrea vs Spaniard Births to Unmarried Women
COMPARE
Immigrants from Eritrea
Spaniard
Births to Unmarried Women
Births to Unmarried Women Comparison
Immigrants from Eritrea
Spaniards
31.7%
BIRTHS TO UNMARRIED WOMEN
50.4/ 100
METRIC RATING
172nd/ 347
METRIC RANK
33.6%
BIRTHS TO UNMARRIED WOMEN
7.0/ 100
METRIC RATING
217th/ 347
METRIC RANK
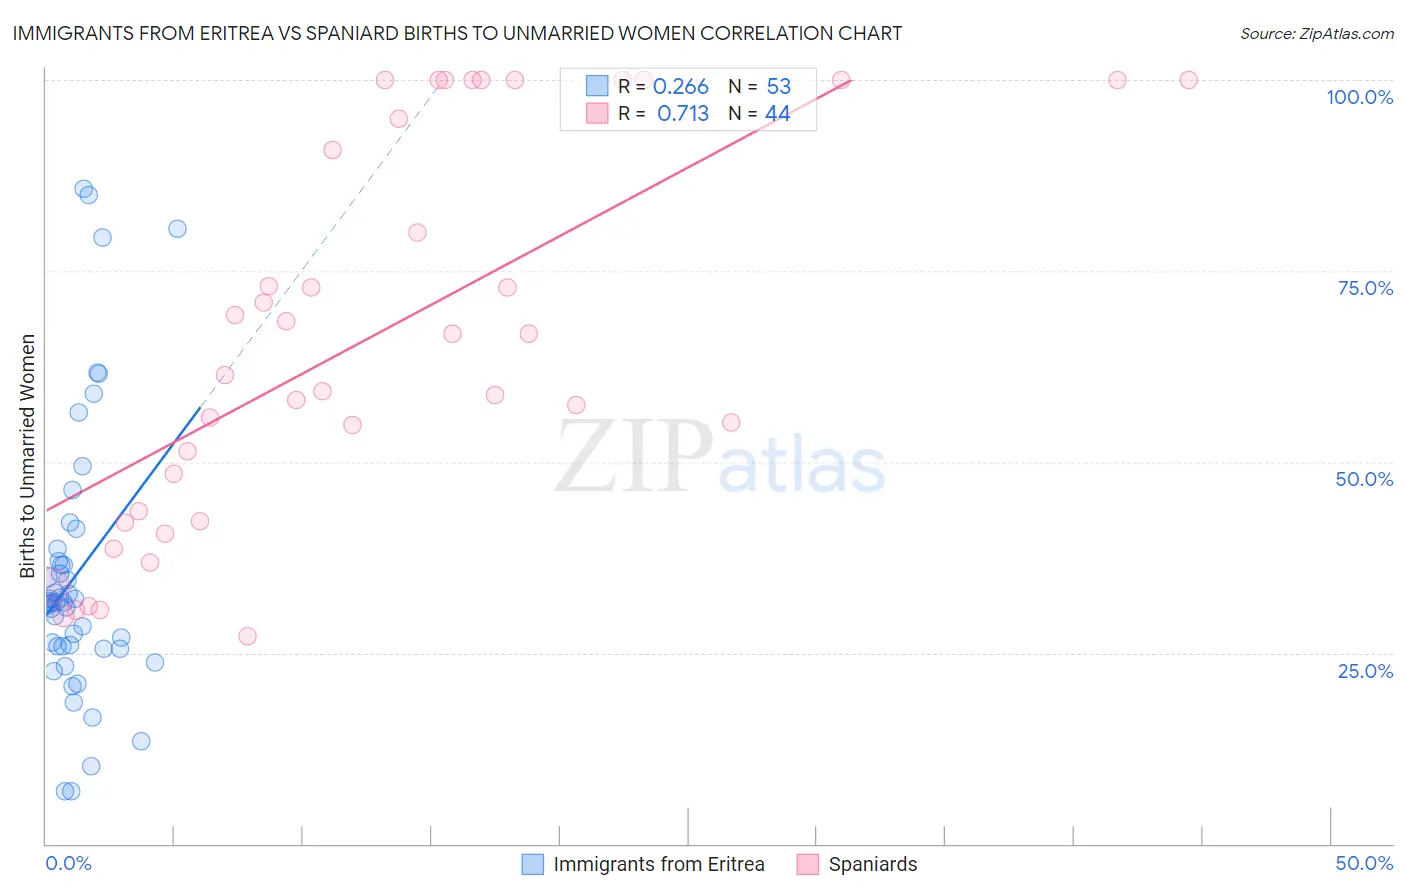
Immigrants from Eritrea vs Spaniard Births to Unmarried Women Correlation Chart
The statistical analysis conducted on geographies consisting of 103,370,880 people shows a weak positive correlation between the proportion of Immigrants from Eritrea and percentage of births to unmarried women in the United States with a correlation coefficient (R) of 0.266 and weighted average of 31.7%. Similarly, the statistical analysis conducted on geographies consisting of 411,709,263 people shows a strong positive correlation between the proportion of Spaniards and percentage of births to unmarried women in the United States with a correlation coefficient (R) of 0.713 and weighted average of 33.6%, a difference of 6.1%.
Births to Unmarried Women Correlation Summary
| Measurement | Immigrants from Eritrea | Spaniard |
| Minimum | 6.8% | 27.1% |
| Maximum | 85.7% | 100.0% |
| Range | 78.9% | 72.9% |
| Mean | 35.2% | 66.2% |
| Median | 31.6% | 64.1% |
| Interquartile 25% (IQ1) | 25.8% | 42.9% |
| Interquartile 75% (IQ3) | 37.8% | 97.4% |
| Interquartile Range (IQR) | 12.0% | 54.5% |
| Standard Deviation (Sample) | 18.1% | 25.1% |
| Standard Deviation (Population) | 17.9% | 24.8% |
Similar Demographics by Births to Unmarried Women
Demographics Similar to Immigrants from Eritrea by Births to Unmarried Women
In terms of births to unmarried women, the demographic groups most similar to Immigrants from Eritrea are Finnish (31.7%, a difference of 0.010%), Immigrants from Yemen (31.7%, a difference of 0.020%), Venezuelan (31.7%, a difference of 0.040%), Guamanian/Chamorro (31.6%, a difference of 0.090%), and Immigrants from Venezuela (31.7%, a difference of 0.12%).
| Demographics | Rating | Rank | Births to Unmarried Women |
| Immigrants | Somalia | 58.1 /100 | #165 | Average 31.4% |
| Peruvians | 55.5 /100 | #166 | Average 31.5% |
| Dutch | 55.3 /100 | #167 | Average 31.5% |
| Belgians | 52.4 /100 | #168 | Average 31.6% |
| Slavs | 52.0 /100 | #169 | Average 31.6% |
| Guamanians/Chamorros | 51.3 /100 | #170 | Average 31.6% |
| Finns | 50.5 /100 | #171 | Average 31.7% |
| Immigrants | Eritrea | 50.4 /100 | #172 | Average 31.7% |
| Immigrants | Yemen | 50.2 /100 | #173 | Average 31.7% |
| Venezuelans | 50.0 /100 | #174 | Average 31.7% |
| Immigrants | Venezuela | 49.2 /100 | #175 | Average 31.7% |
| Scottish | 48.1 /100 | #176 | Average 31.7% |
| South American Indians | 47.7 /100 | #177 | Average 31.7% |
| English | 47.4 /100 | #178 | Average 31.7% |
| South Americans | 46.9 /100 | #179 | Average 31.8% |
Demographics Similar to Spaniards by Births to Unmarried Women
In terms of births to unmarried women, the demographic groups most similar to Spaniards are Nepalese (33.5%, a difference of 0.24%), Immigrants from Ecuador (33.7%, a difference of 0.40%), French (33.4%, a difference of 0.51%), Alsatian (33.8%, a difference of 0.62%), and Portuguese (33.8%, a difference of 0.64%).
| Demographics | Rating | Rank | Births to Unmarried Women |
| Scotch-Irish | 10.7 /100 | #210 | Poor 33.3% |
| Ecuadorians | 10.5 /100 | #211 | Poor 33.3% |
| Celtics | 10.2 /100 | #212 | Poor 33.3% |
| Immigrants | Costa Rica | 9.5 /100 | #213 | Tragic 33.4% |
| Slovaks | 9.3 /100 | #214 | Tragic 33.4% |
| French | 8.7 /100 | #215 | Tragic 33.4% |
| Nepalese | 7.8 /100 | #216 | Tragic 33.5% |
| Spaniards | 7.0 /100 | #217 | Tragic 33.6% |
| Immigrants | Ecuador | 5.9 /100 | #218 | Tragic 33.7% |
| Alsatians | 5.4 /100 | #219 | Tragic 33.8% |
| Portuguese | 5.4 /100 | #220 | Tragic 33.8% |
| Malaysians | 5.0 /100 | #221 | Tragic 33.9% |
| Immigrants | Uruguay | 4.8 /100 | #222 | Tragic 33.9% |
| Pennsylvania Germans | 4.3 /100 | #223 | Tragic 34.0% |
| Immigrants | Laos | 4.3 /100 | #224 | Tragic 34.0% |