Immigrants from Eritrea vs Fijian Currently Married
COMPARE
Immigrants from Eritrea
Fijian
Currently Married
Currently Married Comparison
Immigrants from Eritrea
Fijians
43.6%
CURRENTLY MARRIED
0.1/ 100
METRIC RATING
267th/ 347
METRIC RANK
46.3%
CURRENTLY MARRIED
30.3/ 100
METRIC RATING
189th/ 347
METRIC RANK
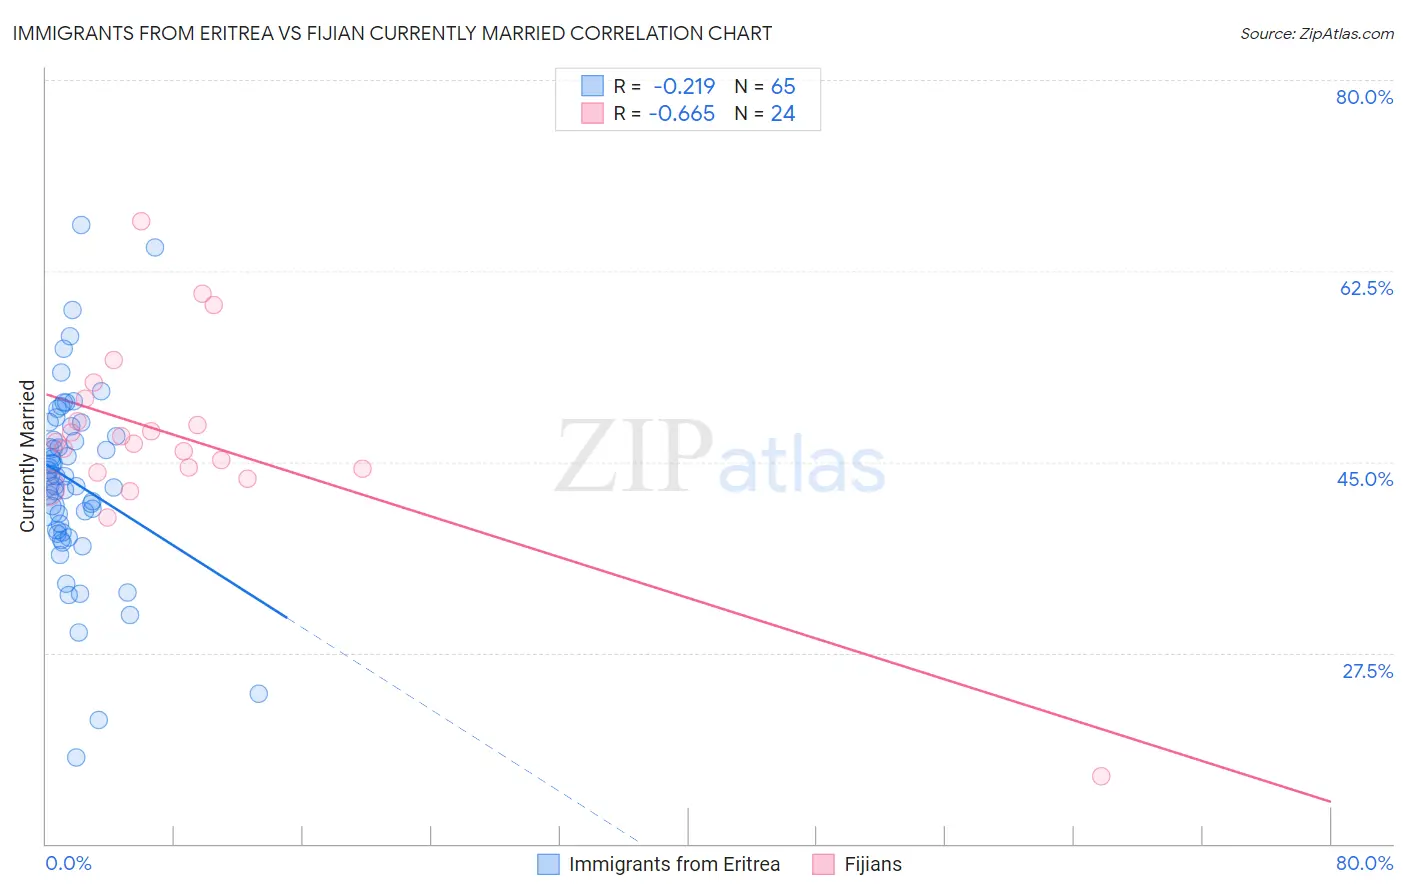
Immigrants from Eritrea vs Fijian Currently Married Correlation Chart
The statistical analysis conducted on geographies consisting of 104,847,164 people shows a weak negative correlation between the proportion of Immigrants from Eritrea and percentage of population currently married in the United States with a correlation coefficient (R) of -0.219 and weighted average of 43.6%. Similarly, the statistical analysis conducted on geographies consisting of 55,948,768 people shows a significant negative correlation between the proportion of Fijians and percentage of population currently married in the United States with a correlation coefficient (R) of -0.665 and weighted average of 46.3%, a difference of 6.2%.
Currently Married Correlation Summary
| Measurement | Immigrants from Eritrea | Fijian |
| Minimum | 17.9% | 16.2% |
| Maximum | 66.7% | 67.1% |
| Range | 48.8% | 50.9% |
| Mean | 43.2% | 47.2% |
| Median | 43.6% | 46.8% |
| Interquartile 25% (IQ1) | 38.6% | 44.2% |
| Interquartile 75% (IQ3) | 47.8% | 49.8% |
| Interquartile Range (IQR) | 9.2% | 5.5% |
| Standard Deviation (Sample) | 8.6% | 9.1% |
| Standard Deviation (Population) | 8.6% | 8.9% |
Similar Demographics by Currently Married
Demographics Similar to Immigrants from Eritrea by Currently Married
In terms of currently married, the demographic groups most similar to Immigrants from Eritrea are Spanish American Indian (43.6%, a difference of 0.0%), Ecuadorian (43.6%, a difference of 0.030%), Immigrants from Bangladesh (43.6%, a difference of 0.10%), Immigrants from Sudan (43.5%, a difference of 0.13%), and Sudanese (43.7%, a difference of 0.18%).
| Demographics | Rating | Rank | Currently Married |
| Immigrants | Latin America | 0.1 /100 | #260 | Tragic 43.8% |
| Immigrants | Nicaragua | 0.1 /100 | #261 | Tragic 43.7% |
| Bangladeshis | 0.1 /100 | #262 | Tragic 43.7% |
| Immigrants | Cuba | 0.1 /100 | #263 | Tragic 43.7% |
| Sudanese | 0.1 /100 | #264 | Tragic 43.7% |
| Immigrants | Bangladesh | 0.1 /100 | #265 | Tragic 43.6% |
| Ecuadorians | 0.1 /100 | #266 | Tragic 43.6% |
| Immigrants | Eritrea | 0.1 /100 | #267 | Tragic 43.6% |
| Spanish American Indians | 0.1 /100 | #268 | Tragic 43.6% |
| Immigrants | Sudan | 0.1 /100 | #269 | Tragic 43.5% |
| Salvadorans | 0.1 /100 | #270 | Tragic 43.5% |
| Bermudans | 0.1 /100 | #271 | Tragic 43.5% |
| Indonesians | 0.1 /100 | #272 | Tragic 43.5% |
| Yaqui | 0.1 /100 | #273 | Tragic 43.4% |
| Nigerians | 0.1 /100 | #274 | Tragic 43.4% |
Demographics Similar to Fijians by Currently Married
In terms of currently married, the demographic groups most similar to Fijians are Choctaw (46.3%, a difference of 0.050%), Colombian (46.3%, a difference of 0.060%), Immigrants from France (46.2%, a difference of 0.12%), Immigrants from Peru (46.4%, a difference of 0.21%), and Soviet Union (46.2%, a difference of 0.21%).
| Demographics | Rating | Rank | Currently Married |
| Potawatomi | 41.9 /100 | #182 | Average 46.5% |
| Immigrants | Northern Africa | 39.7 /100 | #183 | Fair 46.5% |
| Brazilians | 39.3 /100 | #184 | Fair 46.4% |
| Mongolians | 37.6 /100 | #185 | Fair 46.4% |
| Immigrants | Chile | 36.8 /100 | #186 | Fair 46.4% |
| Immigrants | Peru | 35.3 /100 | #187 | Fair 46.4% |
| Colombians | 31.8 /100 | #188 | Fair 46.3% |
| Fijians | 30.3 /100 | #189 | Fair 46.3% |
| Choctaw | 29.1 /100 | #190 | Fair 46.3% |
| Immigrants | France | 27.7 /100 | #191 | Fair 46.2% |
| Soviet Union | 25.7 /100 | #192 | Fair 46.2% |
| Immigrants | Fiji | 25.0 /100 | #193 | Fair 46.2% |
| South Americans | 23.8 /100 | #194 | Fair 46.1% |
| Immigrants | Nepal | 23.7 /100 | #195 | Fair 46.1% |
| Immigrants | Bosnia and Herzegovina | 22.2 /100 | #196 | Fair 46.1% |